Viral Hepatitis Surveillance Report 2018 — Hepatitis C
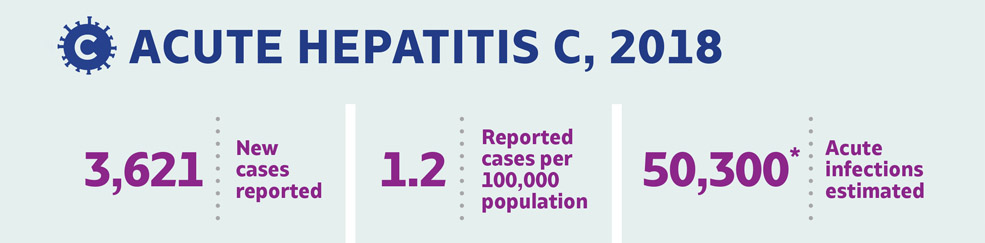
* 95% Bootstrap Confidence Interval: (39,800–171,600)
† Indicates groups above the national average in 2018
† Indicates groups above the national average in 2018
AT A GLANCE: Acute Hepatitis C in 2018
Rates of acute hepatitis C increased in 2018, particularly among those aged 20-39 years, consistent with age groups most impacted by the nation’s opioid crisis.
Groups Most Affected by Acute Hepatitis C in 2018
By Age†
20-29 years: 3.1 cases per 100,000 people
30-39 years: 2.6 cases per 100,000 people
40-49 years: 1.3 cases per 100,000 people
By Sex†
Males: 1.3 cases per 100,000 people
By Race/ Ethnicity†
American Indian/Alaska Native: 3.6 cases per 100,000 people
By Risk
Injection Drug Use (IDU): Among the 1,535 reported cases with IDU information available, 1,102 (72%) report IDU
† Indicates groups above the national average in 2018
On This Page
- Figure 3.1. Number of reported acute hepatitis C cases and estimated infections — United States, 2011–2018
- Table 3.1. Number and rate of reported cases of acute hepatitis C, by state or jurisdiction ― United States, 2014–2018
- Figure 3.2. Rates of reported acute hepatitis C, by state — United States, 2017–2018
- Figure 3.3. Rates of reported acute hepatitis C, by state or jurisdiction — United States, 2018
- Figure 3.4. Rates of reported acute hepatitis C, by age group — United States, 2003–2018
- Figure 3.5. Rates of reported acute hepatitis C, by sex— United States, 2003–2018
- Figure 3.6. Rates of reported acute hepatitis C, by race/ethnicity — United States, 2003–2018
- Table 3.2. Number and rate of reported cases of acute hepatitis C, by demographic characteristics and region — United States 2014–2018
- Figure 3.7. Availability of information on risk behaviors/exposures associated with reported cases of acute hepatitis C — United States, 2018
- Table 3.3. Reported risk behaviors/exposures among reported cases of acute hepatitis C — United States, 2018
- Table 3.4. Number of newly reported cases of perinatal hepatitis C, by state or jurisdiction — United States, 2018
- Table 3.5. Number of newly reported cases of chronic hepatitis C, by state or jurisdiction — United States, 2018
- Figure 3.8. Number of newly reported chronic hepatitis C cases by sex and age — United States, 2018 (N=137,713)
- Table 3.6. Number and rate* of deaths with hepatitis C listed as a cause of death† among U.S. residents, by jurisdiction and year ― United States, 2014–2018
- Figure 3.9. Rate of deaths with hepatitis C listed as a cause of death among U.S. residents, by jurisdiction and year — United States, 2018
- Table 3.7. Number and rate of deaths with hepatitis C listed as a cause of death among U.S. residents, by demographic characteristics, region, and year — United States, 2014–2018
Figure 3.1. Number of reported acute hepatitis C cases and estimated infections* — United States, 2011–2018

| Hepatitis C | 2011 | 2012 | 2013 | 2014 | 2015 | 2016 | 2017 | 2018 |
|---|---|---|---|---|---|---|---|---|
| Reported cases | 1,232 | 1,778 | 2,138 | 2,194 | 2,436 | 2,967 | 3,216 | 3,621 |
| Estimated cases | 17,100 | 24,700 | 29,700 | 30,500 | 33,900 | 41,200 | 44,700 | 50,300 |
Source: CDC, National Notifiable Diseases Surveillance System.
* The number of estimated viral hepatitis infections was determined by multiplying the number of reported cases by a factor that adjusted for under-ascertainment and
under-reporting(7). The 95% bootstrap confidence intervals for the estimated number of infections are shown in the Appendix.
* The number of estimated viral hepatitis infections was determined by multiplying the number of reported cases by a factor that adjusted for under-ascertainment and
under-reporting(7). The 95% bootstrap confidence intervals for the estimated number of infections are shown in the Appendix.
Table 3.1. Number and rate* of reported cases of acute hepatitis C, by state or jurisdiction ― United States, 2014–2018
| State | 2014 No. |
2014 Rate* |
2015 No. |
2015 Rate* |
2016 No. |
2016 Rate* |
2017 No. |
2017 Rate* |
2018 No. |
2018 Rate* |
|---|---|---|---|---|---|---|---|---|---|---|
| Alabama | 35 | 0.7 | 70 | 1.4 | 32 | 0.7 | 17 | 0.3 | 52 | 1.1 |
| Alaska | N | N | N | N | N | N | N | N | N | N |
| Arizona | U | U | U | U | U | U | U | U | U | U |
| Arkansas | 13 | 0.4 | 2 | 0.1 | — | — | 1 | 0.0 | 10 | 0.3 |
| California | 73 | 0.2 | 59 | 0.2 | 60 | 0.2 | 103 | 0.3 | 114 | 0.3 |
| Colorado | 33 | 0.6 | 40 | 0.7 | 35 | 0.6 | 42 | 0.7 | 46 | 0.8 |
| Connecticut | — | — | — | — | 17 | 0.5 | 9 | 0.3 | 10 | 0.3 |
| Delaware | U | U | 4 | 0.4 | 25 | 2.6 | 4 | 0.4 | U | U |
| District of Columbia | U | U | U | U | U | U | U | U | U | U |
| Florida | 93 | 0.5 | 126 | 0.6 | 236 | 1.1 | 357 | 1.7 | 435 | 2.0 |
| Georgia | 57 | 0.6 | 84 | 0.8 | 93 | 0.9 | 100 | 1.0 | 84 | 0.8 |
| Hawaii | — | — | — | — | — | — | — | — | — | — |
| Idaho | 6 | 0.4 | 4 | 0.2 | 7 | 0.4 | 8 | 0.5 | 4 | 0.2 |
| Illinois | 27 | 0.2 | 31 | 0.2 | 21 | 0.2 | 39 | 0.3 | 93 | 0.7 |
| Indiana | 122 | 1.8 | 138 | 2.1 | 146 | 2.2 | 191 | 2.9 | 266 | 4.0 |
| Iowa | U | U | U | U | U | U | U | U | U | U |
| Kansas | 28 | 1.0 | 22 | 0.8 | 15 | 0.5 | 19 | 0.7 | 13 | 0.4 |
| Kentucky | 176 | 4.0 | 119 | 2.7 | 103 | 2.3 | 83 | 1.9 | 164 | 3.7 |
| Louisiana | 22 | 0.5 | 24 | 0.5 | 5 | 0.1 | 7 | 0.1 | 8 | 0.2 |
| Maine | 31 | 2.3 | 30 | 2.3 | 25 | 1.9 | 21 | 1.6 | 23 | 1.7 |
| Maryland | 42 | 0.7 | 38 | 0.6 | 35 | 0.6 | 32 | 0.5 | 38 | 0.6 |
| Massachusetts | 228 | 3.4 | 249 | 3.7 | 424 | 6.2 | 327 | 4.8 | 110 | 1.6 |
| Michigan | 78 | 0.8 | 83 | 0.8 | 107 | 1.1 | 152 | 1.5 | 142 | 1.4 |
| Minnesota | 40 | 0.7 | 37 | 0.7 | 51 | 0.9 | 57 | 1.0 | 60 | 1.1 |
| Mississippi | U | U | U | U | U | U | U | U | U | U |
| Missouri | 6 | 0.1 | 8 | 0.1 | 24 | 0.4 | 49 | 0.8 | 74 | 1.2 |
| Montana | 13 | 1.3 | 15 | 1.5 | 20 | 1.9 | 14 | 1.3 | 8 | 0.8 |
| Nebraska | 2 | 0.1 | 8 | 0.4 | 2 | 0.1 | 2 | 0.1 | 2 | 0.1 |
| Nevada | 6 | 0.2 | 12 | 0.4 | 16 | 0.5 | 35 | 1.2 | 19 | 0.6 |
| New Hampshire | N | N | N | N | N | N | 25 | 1.9 | 25 | 1.8 |
| New Jersey | 113 | 1.3 | 130 | 1.5 | 122 | 1.4 | 125 | 1.4 | 96 | 1.1 |
| New Mexico | 16 | 0.8 | 40 | 1.9 | 18 | 0.9 | 16 | 0.8 | 22 | 1.0 |
| New York | 126 | 0.6 | 121 | 0.6 | 179 | 0.9 | 188 | 0.9 | 236 | 1.2 |
| North Carolina | 111 | 1.1 | 144 | 1.4 | 82 | 0.8 | 114 | 1.1 | 149 | 1.4 |
| North Dakota | — | — | — | — | 1 | 0.1 | 1 | 0.1 | 10 | 1.3 |
| Ohio | 105 | 0.9 | 122 | 1.1 | 187 | 1.6 | 159 | 1.4 | 282 | 2.4 |
| Oklahoma | 45 | 1.2 | 35 | 0.9 | 32 | 0.8 | 46 | 1.2 | 28 | 0.7 |
| Oregon | 15 | 0.4 | 13 | 0.3 | 19 | 0.5 | 35 | 0.8 | 14 | 0.3 |
| Pennsylvania | 69 | 0.5 | 129 | 1.0 | 225 | 1.8 | 224 | 1.7 | 249 | 1.9 |
| Rhode Island | U | U | U | U | U | U | U | U | U | U |
| South Carolina | 4 | 0.1 | 5 | 0.1 | 10 | 0.2 | 13 | 0.3 | 15 | 0.3 |
| South Dakota | — | — | — | — | 20 | 2.3 | 19 | 2.2 | 19 | 2.2 |
| Tennessee | 123 | 1.9 | 173 | 2.6 | 150 | 2.3 | 142 | 2.1 | 157 | 2.3 |
| Texas | 47 | 0.2 | 48 | 0.2 | 40 | 0.1 | 35 | 0.1 | 46 | 0.2 |
| Utah | 38 | 1.3 | 30 | 1.0 | 76 | 2.5 | 81 | 2.6 | 120 | 3.8 |
| Vermont | 4 | 0.6 | 1 | 0.2 | 5 | 0.8 | 9 | 1.4 | 4 | 0.6 |
| Virginia | 54 | 0.6 | 52 | 0.6 | 43 | 0.5 | 62 | 0.7 | 47 | 0.6 |
| Washington | 82 | 1.2 | 63 | 0.9 | 62 | 0.9 | 52 | 0.7 | 101 | 1.3 |
| West Virginia | 62 | 3.4 | 63 | 3.4 | 94 | 5.1 | 102 | 5.6 | 70 | 3.9 |
| Wisconsin | 49 | 0.9 | 64 | 1.1 | 103 | 1.8 | 94 | 1.6 | 134 | 2.3 |
| Wyoming | U | U | U | U | U | U | 5 | 0.9 | 22 | 3.8 |
| Total | 2,194 | 0.7 | 2,436 | 0.8 | 2,967 | 1.0 | 3,216 | 1.0 | 3,621 | 1.2 |
Source: CDC, National Notifiable Diseases Surveillance System.
* Rate per 100,000 population.
† For case definition, see https://wwwn.cdc.gov/nndss/conditions/hepatitis-c-acute/
N: Not reportable. The disease or condition was not reportable by law, statue, or regulation in the reporting jurisdiction.
U: Unavailable. The data are unavailable.
* Rate per 100,000 population.
† For case definition, see https://wwwn.cdc.gov/nndss/conditions/hepatitis-c-acute/
N: Not reportable. The disease or condition was not reportable by law, statue, or regulation in the reporting jurisdiction.
U: Unavailable. The data are unavailable.

Figure 3.3. Rates of reported acute hepatitis C, by state or jurisdiction — United States, 2018

| Color Key |
Cases/100,000 Population |
States |
|---|---|---|
| 0-0.3 | AR, CA, CT, ID, LA, NE, OR, SC, TX | |
| >0.3-0.9 | CO, GA, IL, KS, MD, MT, NV, OK, VT, VA | |
| >0.9-1.3 | AL, MN, MO, NJ, NM, NY, ND, WA | |
| >1.3-2.2 | FL, ME, MA, MI, NH, NC, PA | |
| >2.2-4.0 | IN, KY, OH, SD, TN, UT, WV, WI, WY | |
| Data Not Available | AK, AZ, DE, DC, HI, IA, MS, RI |
Source: CDC, National Notifiable Diseases Surveillance System.
Figure 3.4. Rates of reported acute hepatitis C, by age group — United States, 2003–2018

| Age (years) | 2003 | 2004 | 2005 | 2006 | 2007 | 2008 | 2009 | 2010 | 2011 | 2012 | 2013 | 2014 | 2015 | 2016 | 2017 | 2018 |
|---|---|---|---|---|---|---|---|---|---|---|---|---|---|---|---|---|
| 0-19 | 0.1 | 0.1 | 0.1 | 0.1 | 0.1 | 0.1 | 0.1 | 0.1 | 0.1 | 0.1 | 0.1 | 0.1 | 0.1 | 0.1 | 0.1 | 0.1 |
| 20-29 | 0.5 | 0.4 | 0.4 | 0.5 | 0.5 | 0.6 | 0.7 | 0.8 | 1.2 | 1.7 | 2.0 | 2.2 | 2.4 | 2.7 | 2.8 | 3.1 |
| 30-39 | 0.5 | 0.4 | 0.4 | 0.5 | 0.5 | 0.5 | 0.5 | 0.6 | 0.8 | 1.1 | 1.4 | 1.7 | 1.7 | 2.2 | 2.3 | 2.6 |
| 40-49 | 0.6 | 0.5 | 0.4 | 0.4 | 0.5 | 0.5 | 0.4 | 0.3 | 0.4 | 0.7 | 0.8 | 0.7 | 0.9 | 1.2 | 1.1 | 1.3 |
| 50-59 | 0.3 | 0.3 | 0.2 | 0.3 | 0.3 | 0.4 | 0.2 | 0.3 | 0.3 | 0.4 | 0.5 | 0.4 | 0.6 | 0.6 | 0.8 | 0.9 |
| 60+ | 0.1 | 0.1 | 0.1 | 0.1 | 0.1 | 0.1 | 0.0 | 0.1 | 0.1 | 0.1 | 0.1 | 0.1 | 0.1 | 0.2 | 0.3 | 0.4 |
Source: CDC, National Notifiable Diseases Surveillance System.
Figure 3.5. Rates of reported acute hepatitis C, by sex — United States, 2003–2018

| Sex | 2003 | 2004 | 2005 | 2006 | 2007 | 2008 | 2009 | 2010 | 2011 | 2012 | 2013 | 2014 | 2015 | 2016 | 2017 | 2018 |
|---|---|---|---|---|---|---|---|---|---|---|---|---|---|---|---|---|
| Male | 0.4 | 0.3 | 0.3 | 0.3 | 0.3 | 0.3 | 0.3 | 0.3 | 0.4 | 0.7 | 0.8 | 0.8 | 0.9 | 1.1 | 1.2 | 1.3 |
| Female | 0.3 | 0.2 | 0.2 | 0.2 | 0.3 | 0.3 | 0.3 | 0.3 | 0.4 | 0.5 | 0.7 | 0.7 | 0.7 | 0.9 | 0.9 | 1.0 |
Source: CDC, National Notifiable Diseases Surveillance System.
Figure 3.6. Rates of reported acute hepatitis C, by race/ethnicity — United States, 2003–2018

| Race/ Ethnicity |
2003 | 2004 | 2005 | 2006 | 2007 | 2008 | 2009 | 2010 | 2011 | 2012 | 2013 | 2014 | 2015 | 2016 | 2017 | 2018 |
|---|---|---|---|---|---|---|---|---|---|---|---|---|---|---|---|---|
| American Indian/ Alaska Native | 0.4 | 0.7 | 0.3 | 0.7 | 0.6 | 0.8 | 0.6 | 1.0 | 1.1 | 2.0 | 1.7 | 1.3 | 1.8 | 3.1 | 2.9 | 3.6 |
| Asian/Pacific Islander | 0.1 | 0.1 | 0.0 | 0.1 | 0.0 | 0.0 | 0.0 | 0.1 | 0.1 | 0.1 | 0.1 | 0.1 | 0.1 | 0.1 | 0.1 | 0.2 |
| Black, Non-Hispanic | 0.3 | 0.2 | 0.1 | 0.2 | 0.2 | 0.2 | 0.1 | 0.1 | 0.1 | 0.2 | 0.2 | 0.2 | 0.3 | 0.3 | 0.5 | 0.6 |
| White, Non-Hispanic | 0.3 | 0.2 | 0.2 | 0.2 | 0.3 | 0.3 | 0.3 | 0.3 | 0.5 | 0.6 | 0.8 | 0.8 | 0.9 | 1.1 | 1.2 | 1.3 |
| Hispanic | 0.2 | 0.1 | 0.2 | 0.1 | 0.2 | 0.1 | 0.1 | 0.1 | 0.2 | 0.2 | 0.2 | 0.3 | 0.3 | 0.4 | 0.4 | 0.5 |
Source: CDC, National Notifiable Diseases Surveillance System.
Table 3.2. Number and rate* of reported cases† of acute hepatitis C, by demographic characteristics and region — United States 2014–2018
| State | 2014 No. |
2014 Rate* |
2015 No. |
2015 Rate* |
2016 No. |
2016 Rate* |
2017 No. |
2017 Rate* |
2018 No. |
2018 Rate* |
|---|---|---|---|---|---|---|---|---|---|---|
| Total§ | 2,194 | 0.7 | 2,436 | 0.8 | 2,967 | 1.0 | 3,216 | 1.0 | 3,621 | 1.2 |
| Age group (years) | ||||||||||
| 0–19 | 88 | 0.1 | 99 | 0.1 | 86 | 0.1 | 103 | 0.1 | 81 | 0.1 |
| 20–29 | 918 | 2.2 | 999 | 2.4 | 1,135 | 2.7 | 1,189 | 2.8 | 1,310 | 3.1 |
| 30–39 | 643 | 1.7 | 682 | 1.7 | 868 | 2.2 | 937 | 2.3 | 1,070 | 2.6 |
| 40–49 | 282 | 0.7 | 337 | 0.9 | 452 | 1.2 | 441 | 1.1 | 494 | 1.3 |
| 50–59 | 166 | 0.4 | 240 | 0.6 | 264 | 0.6 | 332 | 0.8 | 366 | 0.9 |
| 60+ | 70 | 0.1 | 77 | 0.1 | 141 | 0.2 | 185 | 0.3 | 295 | 0.4 |
| Sex | ||||||||||
| Male | 1,167 | 0.8 | 1,334 | 0.9 | 1,627 | 1.1 | 1,775 | 1.2 | 2,012 | 1.3 |
| Female | 1,025 | 0.7 | 1,093 | 0.7 | 1,310 | 0.8 | 1,431 | 0.9 | 1,605 | 1.0 |
| Race/ethnicity | ||||||||||
| American Indian/ Alaskan Native | 29 | 1.3 | 39 | 1.7 | 70 | 3.1 | 67 | 2.9 | 83 | 3.6 |
| Asian/Pacific Islander | 11 | 0.1 | 16 | 0.1 | 25 | 0.1 | 23 | 0.1 | 29 | 0.2 |
| Black, Non-Hispanic | 74 | 0.2 | 112 | 0.3 | 130 | 0.3 | 202 | 0.5 | 231 | 0.6 |
| White, Non-Hispanic | 1,569 | 0.8 | 1,724 | 0.9 | 2,109 | 1.1 | 2,227 | 1.2 | 2,405 | 1.3 |
| Hispanic | 124 | 0.2 | 148 | 0.3 | 191 | 0.4 | 234 | 0.4 | 280 | 0.5 |
| HHS Region¶ | ||||||||||
| Region 1 | 263 | 3.0 | 280 | 3.2 | 471 | 3.8 | 391 | 2.8 | 172 | 1.2 |
| Region 2 | 239 | 0.8 | 251 | 0.9 | 301 | 1.0 | 313 | 1.1 | 332 | 1.2 |
| Region 3 | 227 | 0.8 | 286 | 1.0 | 422 | 1.4 | 424 | 1.4 | 404 | 1.4 |
| Region 4 | 599 | 1.0 | 721 | 1.2 | 706 | 1.1 | 826 | 1.3 | 1,056 | 1.7 |
| Region 5 | 421 | 0.8 | 475 | 0.9 | 615 | 1.2 | 692 | 1.3 | 977 | 1.9 |
| Region 6 | 143 | 0.4 | 149 | 0.4 | 95 | 0.2 | 105 | 0.2 | 114 | 0.3 |
| Region 7 | 36 | 0.3 | 38 | 0.3 | 41 | 0.4 | 70 | 0.6 | 89 | 0.8 |
| Region 8 | 84 | 0.8 | 85 | 0.8 | 152 | 1.4 | 162 | 1.4 | 225 | 1.9 |
| Region 9 | 79 | 0.2 | 71 | 0.2 | 76 | 0.2 | 138 | 0.3 | 133 | 0.3 |
| Region 10 | 103 | 0.8 | 80 | 0.6 | 88 | 0.7 | 95 | 0.7 | 119 | 0.9 |
Source: CDC, National Notifiable Diseases Surveillance System.
* Rate per 100,000 population.
† For the case definition, see https://wwwn.cdc.gov/nndss/conditions/hepatitis-c-acute/
§ Numbers reported in each category may not add up to the total number of reported cases in a year due to cases with missing data or, in the case of race/ethnicity, cases categorized as “Other.”
¶ Health and Human Services Regions were categorized according to the grouping of states and U.S. Territories assigned under each of the ten Department of Health and Human Services regional offices (https://www.hhs.gov/about/agencies/iea/regional-offices/index.html). For the purposes of this report, regions with US territories (Region 2 and Region 9) contain data from states only.
Figure 3.7. Availability of information on risk behaviors/exposures* associated with reported cases of acute hepatitis C — United States, 2018


Table 3.3. Reported risk behaviors/exposures† among reported cases of acute hepatitis C — United States, 2018
| Risk behaviors/exposures | Risk identified* | No risk identified | Risk data missing |
|---|---|---|---|
| Injection drug use | 1,102 | 433 | 2,086 |
| Multiple sex partners | 212 | 462 | 2,947 |
| Surgery | 124 | 832 | 2,665 |
| Sexual contact§ | 105 | 278 | 3,238 |
| Needlestick | 91 | 781 | 2,749 |
| Men who have sex with men¶ | 33 | 277 | 1,702 |
| Household contact (non-sexual)§ | 30 | 353 | 3,238 |
| Dialysis patient | 18 | 1,041 | 2,562 |
| Occupational | 7 | 1,145 | 2,469 |
| Transfusion | 1 | 956 | 2,664 |
Source: CDC, Nationally Notifiable Diseases Surveillance System.
* Case reports with at least one of the following risk behaviors/ exposures reported 6 weeks to 6 months prior to symptom onset: 1) injection drug use; 2) sexual contact with suspected/confirmed hepatitis C patient; 3) men who have sex with men; 4) multiple sex partners; 5) occupational exposure to blood; 6) dialysis patient; 7) receive blood transfusion; and 8) underwent surgery.
† Reported cases may include more than one risk behavior/exposure.
§ Cases with more than one type of contact reported were categorized according to a hierarchy: 1) sexual contact; 2) household contact (non-sexual).
¶ A total of 2,012 acute hepatitis C cases were reported among males in 2018.
Table 3.4. Number of newly reported cases* of perinatal hepatitis C, by state or jurisdiction — United States, 2018
| State | Perinatal Hepatitis C |
|---|---|
| Alabama | — |
| Alaska | 1 |
| Arizona | — |
| Arkansas | 1 |
| California | 14 |
| Colorado | 2 |
| Connecticut | — |
| Delaware | U |
| District of Columbia | — |
| Florida | 36 |
| Georgia | 3 |
| Hawaii | — |
| Idaho | — |
| Illinois | 6 |
| Indiana | 20 |
| Iowa | — |
| Kansas | 1 |
| Kentucky | — |
| Louisiana | 3 |
| Maine | — |
| Maryland | 3 |
| Massachusetts | 10 |
| Michigan | 11 |
| Minnesota | 1 |
| Mississippi | — |
| Missouri | — |
| Montana | 1 |
| Nebraska | — |
| Nevada | 2 |
| New Hampshire | — |
| New Jersey | 10 |
| New Mexico | — |
| New York | 3 |
| North Carolina | — |
| North Dakota | — |
| Ohio | 44 |
| Oklahoma | — |
| Oregon | — |
| Pennsylvania | 20 |
| Rhode Island | U |
| South Carolina | — |
| South Dakota | — |
| Tennessee | 4 |
| Texas | N |
| Utah | 4 |
| Vermont | — |
| Virginia | 8 |
| Washington | 4 |
| West Virginia | — |
| Wisconsin | 2 |
| Wyoming | — |
| Total | 214 |
Table 3.5. Number of newly reported cases** of chronic hepatitis C, by state or jurisdiction — United States, 2018
| State | Chronic Hepatitis C |
|---|---|
| Alabama | N |
| Alaska | 872 |
| Arizona | U |
| Arkansas | N |
| California | – |
| Colorado | 2,871 |
| Connecticut | 1,897 |
| Delaware | U |
| District of Columbia | U |
| Florida | 16,193 |
| Georgia | 5,451 |
| Hawaii | U |
| Idaho | 872 |
| Illinois | 4,965 |
| Indiana | N |
| Iowa | 1,498 |
| Kansas | 1,272 |
| Kentucky | N |
| Louisiana | 6,640 |
| Maine | 888 |
| Maryland | 3,882 |
| Massachusetts | 4,772 |
| Michigan | 4,058 |
| Minnesota | 1,225 |
| Mississippi | – |
| Missouri | 4,658 |
| Montana | 967 |
| Nebraska | 696 |
| Nevada | U |
| New Hampshire | 224 |
| New Jersey | 3,882 |
| New Mexico | 956 |
| New York | 8,047 |
| North Carolina | N |
| North Dakota | 717 |
| Ohio | 10,582 |
| Oklahoma | 1,569 |
| Oregon | 3,000 |
| Pennsylvania | 12,874 |
| Rhode Island | U |
| South Carolina | 3,071 |
| South Dakota | 422 |
| Tennessee | 9,949 |
| Texas | N |
| Utah | 1,012 |
| Vermont | 463 |
| Virginia | 4,772 |
| Washington | 5,219 |
| West Virginia | 4,832 |
| Wisconsin | 2,090 |
| Wyoming | 355 |
| Total | 137,713 |
Source: CDC, National Notifiable Diseases Surveillance System.
* For case definition, see https://wwwn.cdc.gov/nndss/conditions/hepatitis-c-perinatal-infection/
* For case definition, see https://wwwn.cdc.gov/nndss/conditions/hepatitis-c-perinatal-infection/
** For case definition, see https://wwwn.cdc.gov/nndss/conditions/hepatitis-c-chronic/
—: No reported cases. The reporting jurisdiction did not submit any cases to CDC.
N: Not reportable. The disease or condition was not reportable by law, statue, or regulation in the reporting jurisdiction.
U: Unavailable. The data are unavailable.
—: No reported cases. The reporting jurisdiction did not submit any cases to CDC.
N: Not reportable. The disease or condition was not reportable by law, statue, or regulation in the reporting jurisdiction.
U: Unavailable. The data are unavailable.
Figure 3.8. Number of newly reported* chronic hepatitis C cases† by sex and age — United States, 2018 (N=137,713)

This graph shows the number of newly reported chronic hepatitis C cases by sex and age in the United States for 2018. Males overall had higher rates of hepatitis C than females. Both males and females showed a biphasic pattern of new infections, with infections rising throughout late teens and early twenties, decreasing through the twenties and thirties, rising again in the late forties through early sixties, then declining for the remaining years.
Source: CDC, National Notifiable Diseases Surveillance System.
* During 2018, cases of chronic hepatitis C were either not reportable by law, statute, or regulation; not reported; or otherwise unavailable to CDC from Alabama, Arizona, Arkansas, California, Delaware, District of Columbia, Hawaii, Indiana, Kentucky, Mississippi, Nevada, North Carolina, Rhode Island, and Texas.
† Only confirmed, newly diagnosed, chronic hepatitis C cases are included. For the complete case definition, see https://wwwn.cdc.gov/nndss/conditions/hepatitis-c-chronic/case-definition/2016/.
Table 3.6. Number and rate* of deaths with hepatitis C listed as a cause of death† among U.S. residents, by jurisdiction and year ― United States, 2014–2018
| State | 2014 No. |
2014 Rate* |
2015 No. |
2015 Rate* |
2016 No. |
2016 Rate* |
2017 No. |
2017 Rate* |
2018 No. |
2018 Rate* |
|---|---|---|---|---|---|---|---|---|---|---|
| Alabama | 246 | 3.97 | 187 | 3.08 | 166 | 2.63 | 188 | 2.97 | 167 | 2.54 |
| Alaska | 60 | 7.13 | 41 | 4.95 | 50 | 5.38 | 38 | 4.38 | 40 | 5.00 |
| Arizona | 553 | 6.90 | 567 | 6.90 | 500 | 5.81 | 480 | 5.45 | 348 | 3.84 |
| Arkansas | 160 | 4.39 | 183 | 5.01 | 184 | 4.91 | 169 | 4.43 | 150 | 3.86 |
| California | 3,409 | 7.66 | 3,245 | 7.19 | 2,917 | 6.33 | 2,630 | 5.58 | 2,391 | 4.98 |
| Colorado | 352 | 5.49 | 362 | 5.51 | 385 | 5.74 | 386 | 5.62 | 387 | 5.48 |
| Connecticut | 156 | 3.25 | 153 | 3.20 | 123 | 2.52 | 130 | 2.61 | 89 | 1.72 |
| Delaware | 50 | 3.91 | 45 | 3.41 | 47 | 3.63 | 49 | 3.80 | 34 | 2.33 |
| District of Columbia | 92 | 13.21 | 101 | 13.93 | 95 | 13.37 | 83 | 11.42 | 70 | 9.40 |
| Florida | 1,266 | 4.71 | 1,270 | 4.62 | 1,222 | 4.26 | 1,222 | 4.16 | 1,005 | 3.34 |
| Georgia | 426 | 3.58 | 396 | 3.26 | 368 | 2.98 | 344 | 2.66 | 326 | 2.46 |
| Hawaii | 87 | 4.99 | 68 | 3.70 | 70 | 3.75 | 67 | 3.48 | 49 | 2.42 |
| Idaho | 110 | 5.44 | 99 | 4.79 | 115 | 5.40 | 84 | 3.82 | 108 | 4.87 |
| Illinois | 364 | 2.33 | 399 | 2.56 | 354 | 2.18 | 288 | 1.72 | 279 | 1.67 |
| Indiana | 263 | 3.26 | 270 | 3.26 | 295 | 3.60 | 269 | 3.16 | 259 | 2.98 |
| Iowa | 112 | 3.04 | 125 | 3.19 | 109 | 2.67 | 122 | 3.01 | 98 | 2.40 |
| Kansas | 126 | 3.62 | 141 | 4.11 | 148 | 4.20 | 141 | 3.83 | 130 | 3.48 |
| Kentucky | 250 | 4.70 | 270 | 5.09 | 269 | 5.05 | 306 | 5.58 | 319 | 5.77 |
| Louisiana | 400 | 7.25 | 396 | 7.15 | 383 | 6.60 | 382 | 6.49 | 352 | 5.92 |
| Maine | 59 | 3.42 | 57 | 3.05 | 40 | 1.87 | 32 | 1.60 | 34 | 1.69 |
| Maryland | 335 | 4.42 | 366 | 4.84 | 327 | 4.32 | 340 | 4.41 | 352 | 4.44 |
| Massachusetts | 303 | 3.65 | 317 | 3.71 | 261 | 2.98 | 267 | 3.00 | 211 | 2.33 |
| Michigan | 511 | 3.88 | 512 | 3.77 | 415 | 3.06 | 368 | 2.61 | 384 | 2.72 |
| Minnesota | 245 | 3.50 | 234 | 3.40 | 240 | 3.28 | 235 | 3.19 | 209 | 2.81 |
| Mississippi | 171 | 4.82 | 162 | 4.57 | 183 | 5.08 | 159 | 4.38 | 141 | 3.70 |
| Missouri | 314 | 4.13 | 275 | 3.50 | 258 | 3.23 | 247 | 3.06 | 244 | 3.09 |
| Montana | 55 | 3.77 | 77 | 5.76 | 75 | 5.71 | 68 | 4.89 | 76 | 5.36 |
| Nebraska | 77 | 3.49 | 82 | 3.60 | 78 | 3.25 | 79 | 3.29 | 72 | 3.26 |
| Nevada | 181 | 5.33 | 173 | 4.80 | 181 | 4.97 | 153 | 4.00 | 140 | 3.59 |
| New Hampshire | 62 | 3.18 | 65 | 3.28 | 68 | 3.57 | 57 | 2.90 | 64 | 3.36 |
| New Jersey | 446 | 3.93 | 400 | 3.52 | 378 | 3.24 | 342 | 2.90 | 309 | 2.64 |
| New Mexico | 205 | 8.29 | 195 | 8.05 | 203 | 8.12 | 175 | 6.70 | 163 | 6.30 |
| New York | 1,092 | 4.42 | 979 | 3.89 | 789 | 3.06 | 701 | 2.71 | 615 | 2.40 |
| North Carolina | 495 | 4.08 | 532 | 4.19 | 511 | 3.92 | 460 | 3.44 | 426 | 3.11 |
| North Dakota | 24 | 2.78 | 32 | 3.55 | 20 | 2.25 | 23 | 2.88 | 23 | 2.52 |
| Ohio | 567 | 3.78 | 559 | 3.70 | 546 | 3.58 | 541 | 3.48 | 480 | 3.16 |
| Oklahoma | 523 | 11.62 | 510 | 11.02 | 538 | 11.46 | 555 | 11.84 | 534 | 11.00 |
| Oregon | 563 | 10.79 | 514 | 9.68 | 491 | 8.90 | 518 | 9.24 | 466 | 8.03 |
| Pennsylvania | 629 | 3.73 | 726 | 4.18 | 564 | 3.28 | 563 | 3.15 | 417 | 2.37 |
| Rhode Island | 104 | 7.70 | 97 | 7.26 | 89 | 6.57 | 76 | 5.15 | 91 | 6.37 |
| South Carolina | 271 | 4.38 | 294 | 4.67 | 299 | 4.51 | 302 | 4.51 | 259 | 3.70 |
| South Dakota | 31 | 3.18 | 35 | 3.33 | 37 | 3.46 | 29 | 2.56 | 30 | 2.80 |
| Tennessee | 554 | 6.83 | 592 | 7.27 | 482 | 5.89 | 469 | 5.57 | 517 | 6.01 |
| Texas | 1,860 | 6.41 | 1,996 | 6.72 | 1,886 | 6.12 | 1,888 | 6.03 | 1,708 | 5.30 |
| Utah | 91 | 3.34 | 98 | 3.47 | 85 | 2.98 | 68 | 2.29 | 78 | 2.59 |
| Vermont | 33 | 3.86 | 43 | 4.87 | 35 | 3.72 | 40 | 4.44 | 30 | 3.32 |
| Virginia | 335 | 3.27 | 330 | 3.15 | 327 | 3.03 | 290 | 2.68 | 272 | 2.48 |
| Washington | 644 | 7.21 | 651 | 7.06 | 517 | 5.53 | 528 | 5.46 | 466 | 4.76 |
| West Virginia | 110 | 4.72 | 107 | 4.65 | 118 | 4.85 | 116 | 4.94 | 108 | 4.90 |
| Wisconsin | 205 | 2.70 | 208 | 2.78 | 214 | 2.70 | 145 | 1.82 | 151 | 1.90 |
| Wyoming | 36 | 4.77 | 30 | 3.95 | 38 | 4.89 | 41 | 5.50 | 42 | 5.84 |
| Total | 19,613 | 5.01 | 19,566 | 4.91 | 18,093 | 4.42 | 17,253 | 4.13 | 15,713 | 3.72 |
Source: CDC, National Center for Health Statistics, Multiple Cause of Death 1999–2018 on CDC WONDER Online Database. Data are from the 2014–2018 Multiple Cause of Death files and are based on information from all death certificates filed in the vital records offices of the fifty states and the District of Columbia through the Vital Statistics Cooperative Program. Deaths of nonresidents (e.g., nonresident aliens, nationals living abroad, residents of Puerto Rico, Guam, the Virgin Islands, and other U.S. Territories) and fetal deaths are excluded. Numbers are slightly lower than previously reported for 2013–2016 due to NCHS standards which restrict displayed data to U.S. residents. Accessed at http://wonder.cdc.gov/mcd-icd10.html on February 14, 2020. CDC WONDER dataset documentation and technical methods can be accessed at https://wonder.cdc.gov/wonder/help/mcd.html#.
* Rates are age-adjusted per 100,000 U.S. standard population in 2000 using the following age group distribution (in years): <1, 1–4, 5–14, 15–24, 25–34, 35–44, 45–54, 55–64, 65–74, 75–84, and 85+. For age-adjusted death rates, the age-specific death rate is rounded to one decimal place before proceeding to the next step in the calculation of age-adjusted death rates for NCHS Multiple Cause of Death on CDC WONDER. This rounding step may affect the precision of rates calculated for small numbers of deaths. Missing data are not included.
† Cause of death is defined as one of the multiple causes of death and is based on the International Classification of Diseases, 10th Revision (ICD-10) codes B17.1, and B18.2 (hepatitis C).
Figure 3.9. Rate of deaths with hepatitis C listed as a cause of death among U.S. residents, by jurisdiction and year — United States, 2018

| Color Key |
Cases/100,000 Population |
States |
|---|---|---|
| 0-2.49 | CT, DE, GA, HI, IL, IA, ME, MA, NY, PA, VA, WI | |
| >2.49-3.12 | AL, IN, MI, MN, MO, NJ, NC, ND, SD, UT | |
| >3.12-3.85 | AZ, FL, KS, MS, NE, NV, NH, OH, SC, VT | |
| >3.85-5.49 | AK, AR, CA, CO, ID, MD, MT, TX, WA, WV | |
| >5.49-11.00 | DC, KY, LA, NM, OK, OR, RI, TN, WY |
Source: CDC, National Center for Health Statistics, Multiple Cause of Death 2018 on CDC WONDER Online Database.
Table 3.7. Number and rate* of deaths with hepatitis C listed as a cause of
death† among U.S. residents, by demographic characteristics, region, and year — United States, 2014–2018
| Demographic characteristic |
2014 No. |
2014 Rate* (95% CI) |
2015 No. |
2015 Rate* (95% CI) |
2016 No. |
2016 Rate* (95% CI) |
2017 No. |
2017 Rate* (95% CI) |
2018 No. |
2018 Rate* (95% CI) |
|---|---|---|---|---|---|---|---|---|---|---|
| Age group (years) | ||||||||||
| 0–34 | 162 | 0.11 (0.09-0.13) |
196 | 0.13 (0.11-0.15) |
164 | 0.11 (0.09-0.13) |
180 | 0.12 (0.10-0.14) |
212 | 0.14 (0.12-0.16) |
| 35–44 | 549 | 1.36 (1.24-1.47) |
592 | 1.46 (1.34-1.58) |
532 | 1.31 (1.20-1.43) |
507 | 1.24 (1.13-1.35) |
499 | 1.21 (1.10-1.31) |
| 45–54 | 4,108 | 9.45 (9.16-9.74) |
3,659 | 8.47 (8.20-8.75) |
3,026 | 7.07 (6.82-7.32) |
2,556 | 6.03 (5.80-6.27) |
2,040 | 4.90 (4.69-5.11) |
| 55–64 | 9,976 | 24.89 (24.40-25.38) |
9,678 | 23.68 (23.20-24.15) |
9,011 | 21.73 (21.28-22.18) |
8,275 | 19.70 (19.28-20.13) |
7,297 | 17.26 (16.87-17.66) |
| 65–74 | 3,382 | 12.81 (12.38-13.24) |
4,009 | 14.55 (14.10-15.00) |
4,071 | 14.22 (13.78-14.66) |
4,397 | 14.81 (14.38-15.25) |
4,429 | 14.52 (14.10-14.95) |
| 75+ | 1,431 | 7.21 (6.84-7.58) |
1,431 | 7.08 (6.71-7.45) |
1,288 | 6.25 (5.91-6.59) |
1,329 | 6.28 (5.94-6.61) |
1,235 | 5.63 (5.32-5.94) |
| Race/ethnicity | ||||||||||
| White, Non-Hispanic | 12,438 | 4.42 (4.34-4.50) |
12,329 | 4.35 (4.27-4.43) |
11,389 | 3.95 (3.88-4.03) |
10,781 | 3.70 (3.63-3.78) |
9,858 | 3.35 (3.28-3.42) |
| Black, Non-Hispanic | 3,535 | 8.12 (7.85-8.39) |
3,602 | 8.13 (7.86-8.40) |
3,360 | 7.42 (7.16-7.68) |
3,262 | 7.03 (6.79-7.28) |
2,978 | 6.31 (6.08-6.54) |
| Hispanic | 2,792 | 6.90 (6.63-7.16) |
2,737 | 6.48 (6.23-6.74) |
2,510 | 5.76 (5.53-6.00) |
2,399 | 5.29 (5.08-5.51) |
2,190 | 4.64 (4.44-4.84) |
| Asian/ Pacific Islander, Non-Hispanic | 419 | 2.43 (2.19-2.67) |
415 | 2.32 (2.09-2.55) |
384 | 2.03 (1.82-2.24) |
368 | 1.86 (1.67-2.05) |
300 | 1.43 (1.27-1.60) |
| American Indian / Alaska Native, Non-Hispanic | 287 | 10.05 (8.86-11.24) |
324 | 11.45 (10.18-12.73) |
285 | 9.80 (8.63-10.97) |
299 | 10.24 (9.04-11.44) |
264 | 9.05 (7.93-10.17) |
| Sex | ||||||||||
| Male | 13,962 | 7.38 (7.26-7.51) |
14,043 | 7.27 (7.15-7.40) |
12,815 | 6.48 (6.36-6.59) |
12,287 | 6.12 (6.01-6.23) |
11,242 | 5.53 (5.42-5.63) |
| Female | 5,651 | 2.82 (2.75-2.90) |
5,523 | 2.71 (2.63-2.78) |
5,278 | 2.54 (2.47-2.61) |
4,966 | 2.32 (2.26-2.39) |
4,471 | 2.09 (2.02-2.15) |
| DHHS Region | ||||||||||
| Region 1: Boston | 717 | 3.77 (3.48-4.05) |
732 | 3.78 (3.50-4.07) |
616 | 3.10 (2.85-3.35) |
602 | 2.97 (2.72-3.21) |
519 | 2.56 (2.33-2.79) |
| Region 2: New York | 1,538 | 4.27 (4.05-4.49) |
1,379 | 3.78 (3.58-3.98) |
1167 | 3.12 (2.94-3.30) |
1,043 | 2.76 (2.59-2.93) |
924 | 2.48 (2.31-2.64) |
| Region 3: Philadelphia | 1,551 | 3.95 (3.75-4.15) |
1,675 | 4.17 (3.96-4.37) |
1,478 | 3.68 (3.48-3.87) |
1,441 | 3.53 (3.35-3.72) |
1,253 | 3.04 (2.87-3.22) |
| Region 4: Atlanta | 3,679 | 4.61 (4.46-4.76) |
3,703 | 4.53 (4.38-4.68) |
3,500 | 4.18 (4.03-4.32) |
3,450 | 4.03 (3.89-4.16) |
3,160 | 3.60 (3.47-3.72) |
| Region 5: Chicago | 2,155 | 3.23 (3.10-3.37) |
2,182 | 3.24 (3.11-3.38) |
2,064 | 3.01 (2.88-3.15) |
1,846 | 2.63 (2.51-2.75) |
1,762 | 2.52 (2.40-2.64) |
| Region 6: Dallas | 3,148 | 6.94 (6.69-7.18) |
3,280 | 7.08 (6.83-7.33) |
3,194 | 6.69 (6.45-6.92) |
3,169 | 6.54 (6.31-6.77) |
2,907 | 5.85 (5.64-6.07) |
| Region 7: Kansas City | 629 | 3.96 (3.40-3.99) |
623 | 3.58 (3.29-3.87) |
593 | 3.31 (3.04-3.59) |
589 | 3.24 (2.97-3.51) |
544 | 3.04 (2.78-3.30) |
| Region 8: Denver | 589 | 4.44 (4.07-4.80) |
634 | 4.67 (4.30-5.04) |
640 | 4.69 (4.32-5.06) |
615 | 4.38 (4.02-4.73) |
636 | 4.45 (4.09-4.80) |
| Region 9: San Francisco | 4,230 | 7.30 (7.07-7.52) |
4,053 | 6.84 (6.63-7.05) |
3,668 | 6.08 (5.88-6.28) |
3,330 | 5.37 (5.19-5.56) |
2,928 | 4.63 (4.46-4.80) |
| Region 10: Seattle | 1,377 | 8.10 (7.66-8.54) |
1,305 | 7.49 (7.08-7.91) |
1,173 | 6.56 (6.17-6.94) |
1,168 | 6.38 (6.01-6.76) |
1,080 | 5.79 (5.43-6.14) |
| Overall | 19,613 | 5.01 (4.93-5.08) |
19,566 | 4.91 (4.84-4.98) |
18,093 | 4.42 (4.36-4.49) |
17,253 | 4.13 (4.07-4.20) |
15,713 | 3.72 (3.66-3.78) |
Source: CDC, National Center for Health Statistics, Multiple Cause of Death 1999–2018 on CDC WONDER Online Database. Data are from the 2014–2018 Multiple Cause of Death files and are based on information from all death certificates filed in the vital records offices of the fifty states and the District of Columbia through the Vital Statistics Cooperative Program. Deaths of nonresidents (e.g., nonresident aliens, nationals living abroad, residents of Puerto Rico, Guam, the Virgin Islands, and other U.S. Territories) and fetal deaths are excluded. Numbers are slightly lower than previously reported for 2013–2016 due to NCHS standards which restrict displayed data to U.S. residents. Accessed at http://wonder.cdc.gov/mcd-icd10.html on February 14, 2020. CDC WONDER dataset documentation and technical methods can be accessed at https://wonder.cdc.gov/wonder/help/mcd.html#.
* Rates for race/ethnicity, sex, and the overall total are age-adjusted per 100,000 U.S. standard population in 2000 using the following age group distribution (in years): <1, 1–4, 5–14, 15–24, 2 SYMFONISK 5–34, 35–44, 45–54, 55–64, 65–74, 75–84, and 85+. Missing data are not included. For age-adjusted death rates, the age-specific death rate is rounded to one decimal place before proceeding to the next step in the calculation of age-adjusted death rates for NCHS Multiple Cause of Death on CDC WONDER. This rounding step may affect the precision of rates
calculated for small numbers of deaths.
† Cause of death is defined as one of the multiple causes of death and is based on the International Classification of Diseases, 10th Revision (ICD-10) codes B17.1, and B18.2 (hepatitis C).