Lesson 6: Investigating an Outbreak
Section 2: Steps of an Outbreak Investigation
Once the decision to conduct a field investigation of an acute outbreak has been made, working quickly is essential — as is getting the right answer. In other words, epidemiologists cannot afford to conduct an investigation that is “quick and dirty.” They must conduct investigations that are “quick and clean.”(22) Under such circumstances, epidemiologists find it useful to have a systematic approach to follow, such as the sequence listed in Table 6.2. This approach ensures that the investigation proceeds without missing important steps along the way.
Table 6.2 Epidemiologic Steps of an Outbreak Investigation
- Prepare for field work
- Establish the existence of an outbreak
- Verify the diagnosis
- Construct a working case definition
- Find cases systematically and record information
- Perform descriptive epidemiology
- Develop hypotheses
- Evaluate hypotheses epidemiologically
- As necessary, reconsider, refine, and re-evaluate hypotheses
- Compare and reconcile with laboratory and/or environmental studies
- Implement control and prevention measures
- Initiate or maintain surveillance
- Communicate findings
The steps listed in Table 6.2 are presented in conceptual order; in practice, however, several steps may be done at the same time, or the circumstances of the outbreak may dictate that a different order be followed. For example, the order of the first three listed steps is highly variable — a health department often verifies the diagnosis and establishes the existence of an outbreak before deciding that a field investigation is warranted. Conceptually, control measures come after hypotheses have been confirmed, but in practice control measures are usually implemented as soon as the source and mode of transmission are known, which may be early or late in any particular outbreak investigation.
Each of the steps is described below in more detail, based on the assumption that you are the health department staff member scheduled to conduct the next field investigation.
Step 1: Prepare for field work
The numbering scheme for this step is problematic, because preparing for field work often is not the first step. Only occasionally do public health officials decide to conduct a field investigation before confirming an increase in cases and verifying the diagnosis. More commonly, officials discover an increase in the number of cases of a particular disease and then decide that a field investigation is warranted. Sometimes investigators collect enough information to perform descriptive epidemiology without leaving their desks, and decide that a field investigation is necessary only if they cannot reach a convincing conclusion without one.
Regardless of when the decision to conduct a field investigation is made, you should be well prepared before leaving for the field. The preparations can be grouped into two broad categories: (a) scientific and investigative issues, and (b) management and operational issues. Good preparation in both categories is needed to facilitate a smooth field experience.
Scientific and investigative issues
As a field investigator, you must have the appropriate scientific knowledge, supplies, and equipment to carry out the investigation before departing for the field. Discuss the situation with someone knowledgeable about the disease and about field investigations, and review the applicable literature. In previous similar outbreaks, what have been the sources, modes of transmission, and risk factors for the disease? Assemble useful references such as journal articles and sample questionnaires.
Before leaving for a field investigation, consult laboratory staff to ensure that you take the proper laboratory material and know the proper collection, storage, and transportation techniques. By talking with the laboratory staff you are also informing them about the outbreak, and they can anticipate what type of laboratory resources will be needed.
You also need to know what supplies or equipment to bring to protect yourself. Some outbreak investigations require no special equipment while an investigation of SARS or Ebola hemorrhagic fever may require personal protective equipment such as masks, gowns, and gloves.
Finally, before departing, you should have a plan of action. What are the objectives of this investigation, i.e., what are you trying to accomplish? What will you do first, second, and third? Having a plan of action upon which everyone agrees will allow you to “hit the ground running” and avoid delays resulting from misunderstandings.
Management and operational issues
A good field investigator must be a good manager and collaborator as well as a good epidemiologist, because most investigations are conducted by a team rather than just one individual. The team members must be selected before departure and know their expected roles and responsibilities in the field. Does the team need a laboratorian, veterinarian, translator/interpreter, computer specialist, entomologist, or other specialist? What is the role of each? Who is in charge? If you have been invited to participate but do not work for the local health agency, are you expected to lead the investigation, provide consultation to the local staff who will conduct the investigation, or simply lend a hand to the local staff? And who are your local contacts?
Depending on the type of outbreak, the number of involved agencies may be quite large. The investigation of an outbreak from an animal source may include state and federal departments of agriculture and/or the Food and Drug Administration (FDA). If criminal or bioterrorist intent is suspected, law enforcement agencies and the Federal Bureau of Investigation (FBI) may be in charge, or at least involved. In a natural disaster (hurricane or flood), the Federal Emergency Management Agency (FEMA) may be the lead. Staff from different agencies have different perspectives, approaches, and priorities that must be reconciled. For example, whereas the public health investigation may focus on identifying a pathogen, source, and mode of transmission, a criminal investigation is likely to focus on finding the perpetrator. Sorting out roles and responsibilities in such multi-agency investigations is critical to accomplishing the disparate objectives of the different agencies.
A communications plan must be established. The need for communicating with the public health and clinical community has long been acknowledged, but the need for communicating quickly and effectively with elected officials and the public became obvious during the epidemics of West Nile Virus encephalitis, SARS, and anthrax. The plan should include how often and when to have conference calls with involved agencies, who will be the designated spokesperson, who will prepare health alerts and press releases, and the like. When a federal agency is involved in the survey of 10 or more individuals, the data collection instrument must first be cleared by the White House Office of Management and Budget (OMB).
In addition, operational and logistical details are important.
Arrange to bring a laptop computer, cell phone or phone card, camera, and other supplies. If you are arriving from outside the area, you should arrange in advance when and where you are to meet with local officials and contacts when you arrive in the field. You must arrange travel, lodging, and local transportation. Many agencies and organizations have strict approval processes and budgetary limits that you must follow. If you are traveling to another country, you will need a passport and often a visa. You should also take care of personal matters before you leave, especially if the investigation is likely to be lengthy.
Step 2: Establish the existence of an outbreak
An outbreak or an epidemic is the occurrence of more cases of disease than expected in a given area or among a specific group of people over a particular period of time. Usually, the cases are presumed to have a common cause or to be related to one another in some way. Many epidemiologists use the terms outbreak and epidemic interchangeably, but the public is more likely to think that epidemic implies a crisis situation. Some epidemiologists apply the term epidemic to situations involving larger numbers of people over a wide geographic area. Indeed, the Dictionary of Epidemiology defines outbreak as an epidemic limited to localized increase in the incidence of disease, e.g., village, town, or closed institution.(23)
In contrast to outbreak and epidemic, a cluster is an aggregation of cases in a given area over a particular period without regard to whether the number of cases is more than expected. This aggregation of cases seems to be unusual, but frequently the public (and sometimes the health agency) does not know the denominator. For example, the diagnosis in one neighborhood of four adults with cancer may be disturbing to residents but may well be within the expected level of cancer occurrence, depending on the size of the population, the types of cancer, and the prevalence of risk factors among the residents.
One of the first tasks of the field investigator is to verify that a cluster of cases is indeed an outbreak. Some clusters turn out to be true outbreaks with a common cause, some are sporadic and unrelated cases of the same disease, and others are unrelated cases of similar but unrelated diseases.
Even if the cases turn out to be the same disease, the number of cases may not exceed what the health department normally sees in a comparable time period. Here, as in other areas of epidemiology, the observed is compared with the expected. The expected number is usually the number from the previous few weeks or months, or from a comparable period during the previous few years. For a notifiable disease, the expected number is based on health department surveillance records. For other diseases and conditions, the expected number may be based on locally available data such as hospital discharge records, mortality statistics, or cancer or birth defect registries. When local data are not available, a health department may use rates from state or national data, or, alternatively, conduct a telephone survey of physicians to determine whether they are seeing more cases of the disease than usual. Finally, a survey of the community may be conducted to establish the background or historical level of disease.
Even if the current number of reported cases exceeds the expected number, the excess may not necessarily indicate an outbreak. Reporting may rise because of changes in local reporting procedures, changes in the case definition, increased interest because of local or national awareness, or improvements in diagnostic procedures. A new physician, infection control nurse, or healthcare facility may more consistently report cases, when in fact there has been no change in the actual occurrence of the disease. Some apparent increases are actually the result of misdiagnosis or laboratory error. Finally, particularly in areas with sudden changes in population size such as resort areas, college towns, and migrant farming areas, changes in the numerator (number of reported cases) may simply reflect changes in the denominator (size of the population).
Whether an apparent problem should be investigated further is not strictly tied to verifying the existence of an epidemic (more cases than expected). Sometimes, health agencies respond to small numbers of cases, or even a single case of disease, that may not exceed the expected or usual number of cases. As noted earlier, the severity of the illness, the potential for spread, availability of control measures, political considerations, public relations, available resources, and other factors all influence the decision to launch a field investigation.
 Exercise 6.2
For the month of August, 12 new cases of tuberculosis and 12 new cases of West Nile virus infection were reported to a county health department. You are not sure if either group of cases is a cluster or an outbreak. What additional information might be helpful in making this determination?
Step 3: Verify the diagnosis
The next step, verifying the diagnosis, is closely linked to verifying the existence of an outbreak. In fact, often these two steps are addressed at the same time. Verifying the diagnosis is important: (a) to ensure that the disease has been properly identified, since control measures are often disease-specific; and (b) to rule out laboratory error as the basis for the increase in reported cases.
First, review the clinical findings and laboratory results. If you have questions about the laboratory findings (for example, if the laboratory tests are inconsistent with the clinical and epidemiologic findings), ask a qualified laboratorian to review the laboratory techniques being used. If you need specialized laboratory work such as confirmation in a reference laboratory, DNA or other chemical or biological fingerprinting, or polymerase chain reaction, you must secure a sufficient number of appropriate specimens, isolates, and other laboratory material as soon as possible.
Second, many investigators — clinicians and non-clinicians — find it useful to visit one or more patients with the disease. If you do not have the clinical background to verify the diagnosis, bring a qualified clinician with you. Talking directly with some patients gives you a better understanding of the clinical features, and helps you to develop a mental image of the disease and the patients affected by it. In addition, conversations with patients are very useful in generating hypotheses about disease etiology and spread. They may be able to answer some critical questions: What were their exposures before becoming ill? What do they think caused their illness? Do they know anyone else with the disease? Do they have anything in common with others who have the disease?
Third, summarize the clinical features using frequency distributions. Are the clinical features consistent with the diagnosis? Frequency distributions of the clinical features are useful in characterizing the spectrum of illness, verifying the diagnosis, and developing case definitions. These clinical frequency distributions are considered so important in establishing the credibility of the diagnosis that they are frequently presented in the first table of an investigation’s report or manuscript.
Step 4: Construct a working case definition
Textbox module not selected or not found.A case definition is a standard set of criteria for deciding whether an individual should be classified as having the health condition of interest. A case definition includes clinical criteria and — particularly in the setting of an outbreak investigation — restrictions by time, place, and person. The clinical criteria should be based on simple and objective measures such as “fever ≥ 40°C (101°F),” “three or more loose bowel movements per day,” or “myalgias (muscle pain) severe enough to limit the patient’s usual activities. ” The case definition may be restricted by time (for example, to persons with onset of illness within the past 2 months), by place (for example, to residents of the nine-county area or to employees of a particular plant) and by person (for example, to persons with no previous history of a positive tuberculin skin test, or to premenopausal women). Whatever the criteria, they must be applied consistently to all persons under investigation.
The case definition must not include the exposure or risk factor you are interested in evaluating. This is a common mistake. For example, if one of the hypotheses under consideration is that persons who worked in the west wing were at greater risk of disease, do not define a case as “illness among persons who worked in the west wing with onset between…” Instead, define a case as “illness among persons who worked in the facility with onset between…” Then conduct the appropriate analysis to determine whether those who worked in the west wing were at greater risk than those who worked elsewhere.
Diagnoses may be uncertain, particularly early in an investigation. As a result, investigators often create different categories of a case definition, such as confirmed, probable, and possible or suspect, that allow for uncertainty. To be classified as confirmed, a case usually must have laboratory verification. A case classified as probable usually has typical clinical features of the disease without laboratory confirmation. A case classified as possible usually has fewer of the typical clinical features. For example, in the box on page 6-16, you can see the Pan American Health Organization (PAHO) recommended case definition for meningococcal disease.(24) Here you can see the different categories that PAHO uses for this diagnosis.
Meningococcal Disease — PAHO Case Definition
Clinical case definition
An illness with sudden onset of fever (>38.5°C rectal or >38.0°C axillary) and one or more of the following: neck stiffness, altered consciousness, other meningeal sign or petechial or puerperal rash.
Laboratory criteria for diagnosis
Positive cerebrospinal fluid (CSF) antigen detection or positive culture.
Case classification
Suspected: A case that meets the clinical case definition.
Probable: A suspected case as defined above and turbid CSF (with or without positive Gram stain) or ongoing epidemic and epidemiological link to a confirmed case.
Confirmed: A suspected or probable case with laboratory confirmation.
Source: Pan American Health Organization. Case Definitions Meningococcal Disease. Epidemiological Bulletin 2002; 22(4):14–5.
In the outbreak setting, the investigators would need to specify time and place to complete the outbreak case definition. For example, if investigating an epidemic of meningococcal meningitis in Bamako, the case definition might be the clinical features as described in the box with onset between January and April of this year among residents and visitors of Bamako.
Classifications such as confirmed-probable-possible are helpful because they provide flexibility to the investigators. A case might be temporarily classified as probable or possible while laboratory results are pending. Alternatively, a case may be permanently classified as probable or possible if the patient’s physician decided not to order the confirmatory laboratory test because the test is expensive, difficult to obtain, or unnecessary. For example, while investigating an outbreak of diarrhea on a cruise ship, investigators usually try to identify the causative organism from stool samples from a few afflicted persons. If the tests confirm that all of those case-patients were infected with the same organism, for example norovirus, the other persons with compatible clinical illness are all presumed to be part of the same outbreak and to be infected with the same organism. Note that while this approach is typical in the United States, some countries prefer to acquire laboratory samples from every affected person, and only those with a positive laboratory test are counted as true cases.
A case definition is a tool for classifying someone as having or not having the disease of interest, but few case definitions are 100% accurate in their classifications. Some persons with mild illness may be missed, and some persons with a similar but not identical illness may be included. Generally, epidemiologists strive to ensure that a case definition includes most if not all of the actual cases, but very few or no false-positive cases. However, this ideal is not always met. For example, case definitions often miss infected people who have mild or no symptoms, because they have little reason to be tested.
More About Case Definitions
Early in an investigation, investigators may use a “loose” or sensitive case definition that includes confirmed, probable, and possible cases to characterize the extent of the problem, identify the populations affected, and develop hypotheses about possible causes. The strategy of being more inclusive early on is especially useful in investigations that require travel to different hospitals, homes, or other sites to gather information, because collecting extra data while you are there is more efficient than having to return a second time. This illustrates an important axiom of field epidemiology: Get it while you can. Later on, when hypotheses have come into sharper focus, the investigator may tighten the case definition by dropping the “possible” and sometimes the “probable” category. In analytic epidemiology, inclusion of false-positive cases can produce misleading results. Therefore, to test these hypotheses by using analytic epidemiology (see Step 8), specific or tight case definitions are recommended.
Other investigations, particularly those of a newly recognized disease or syndrome, begin with a relatively specific or narrow case definition. For example, acquired immunodeficiency syndrome (AIDS) and severe acute respiratory syndrome (SARS) both began with relatively specific case definitions. This ensures that persons whose illness meets the case definition truly have the disease in question. As a result, investigators could accurately characterize the typical clinical features of the illness, risk factors for illness, and cause of the illness. After the cause was known and diagnostic tests were developed, investigators could use the laboratory test to learn about the true spectrum of illness, and could broaden the case definition to include those with early infection or mild symptoms.
 Exercise 6.3
In 1989, a worldwide epidemic of a previously unrecognized syndrome occurred. This condition was characterized by severe myalgias (muscle pains) and an elevated number of a particular type of white blood cell called an eosinophil. The illness was given the name eosinophilia-myalgia syndrome. Public health officials initially used the following case definition:(25)
Eosinophil count ≥2,000 cells/mm3 in the absence of any other known cause of eosinophilia (in particular, parasitic or fungal infection, end-stage renal disease, leukemia, allergic disorder, or drug reaction)
Using the information in the line listing below, determine whether or not each should be classified as a case, according to the initial case definition above.
Table 6.3 Line Listing of 7 Persons with Suspected Eosinophilia-myalgia
| Patient # | Eosinophils (per mm3) | Other Known Cause | Severe Myalgias | Myalgias* | Case? (Initial Def) | Case? (Revised Def) |
|---|---|---|---|---|---|---|
| 1 | 535 | No | Yes | No |  |
 |
| 2 | 12,100 | No | Yes | Yes |  |
 |
| 3 | 2,310 | No | Yes | Yes |  |
 |
| 4 | 2,064 | No | Yes | No |  |
 |
| 5 | 2,250 | No | Yes | Yes |  |
 |
| 6 | 1,670 | No | Yes | Yes |  |
 |
| 7 | 2,115 | Leukemia | Yes | Yes |  |
 |
* Severe enough to affect the patient’s ability to pursue usual daily activities
Eventually, public health officials agreed on the following revised case definition:(26)
- A peripheral eosinophil count of ≥1,000 cells/mm3;
- Generalized myalgia at some point during the illness severe enough to affect the patient’s ability to pursue usual daily activities;
- No infection or neoplasm that could account for #1 or #2.
Reclassify each patient using the revised case definition.
 Exercise 6.4
In December 2003, an outbreak of gastroenteritis occurred among tenth-grade students who had participated in a city-wide field trip. Half of the students traveled from December 2 to December 7 (Tour A); the other half traveled from December 3 to December 8 (Tour B). The itineraries were similar. Although teachers and other adult chaperones accompanied the students on both tours, no adult reported illness. In addition, no illness was reported among students who did not go on the field trip, and no cases of E. coli O157 were reported in the community that week.
A line listing of 26 persons with symptoms of abdominal pain and/or diarrhea is presented below. Using the information in the line listing, develop a case definition that you might use for the outbreak investigation. [Note that persons infected with E. coli O157 typically experience severe abdominal cramps, bloody diarrhea, and low grade fever after a 1– to 8–day incubation period (usually 2–4 days). ]
Table 6.4 Line Listing of 26 Persons with Symptoms — School District A, December 2003
| Patient # | Grade & School | Age | Sex | Tour | Onset Date | Severe Abdominal Pain? | No. Times Diarrhea | Stool Testing |
|---|---|---|---|---|---|---|---|---|
| 1 | 10 — 1 | 17 | M | A | Dec. 8 | Y | 3 | Not done |
| 2 | 10 — 1 | 16 | F | A | Dec. 6 | N | 1 | Negative |
| 3 | 10 — 2 | 16 | M | A | Dec. 10 | Y | 2 | E. coli O157 |
| 4 | 10 — 2 | 17 | F | A | Dec. 8 | Y | 3 | Not done |
| 5 | 10 — 2 | 16 | F | A | Dec. 5 | Y | 8 | E. coli O157 |
| 6 | 10 — 2 | 16 | M | A | Dec. 6 | Y | 3 | Not done |
| 7 | 10 — 3 | 17 | M | A | Dec. 7 | Y | 4 | Not done |
| 8 | 10 — 3 | 17 | F | A | Dec. 8 | Y | 2 | E. coli O157 |
| 9 | 10 — 3 | 16 | F | A | Dec. 7 | Y | 3 | Negative |
| 10 | 10 — 4 | 17 | F | A | Dec. 7 | Y | 2 | E. coli O157 |
| 11 | 10 — 4 | 16 | M | A | Dec. 8 | Y | 3 | Not done |
| 12 | 10 — 4 | 16 | M | A | Dec. 9 | Y | 3 | Negative |
| 13 | 10 — 5 | 16 | F | A | Dec. 8 | Y | 3 | Not done |
| 14 | 10 — 6 | 17 | F | B | Dec. 8 | Y | 3 | E. coli O157 |
| 15 | 10 — 6 | 16 | F | B | Dec. 9 | Y | 2 | Negative |
| 16 | 10 — 7 | 17 | F | B | Dec. 6 | Y | 3 | Not done |
| 17 | 10 — 7 | 17 | F | B | Dec. 7 | Y | 5 | E. coli O157 |
| 18 | 10 — 7 | 16 | F | B | Dec. 8 | Y | 2 | Negative |
| 19 | 10 — 8 | 17 | F | B | Dec. 6 | Y | 5 | E. coli O157 |
| 20 | 10 — 8 | 17 | F | B | Dec. 7 | Y | 3 | Negative |
| 21 | 10 — 9 | 16 | M | B | Dec. 8 | Y | 2 | Not done |
| 22 | 10 — 9 | 16 | F | B | Dec. 7 | Y | 3 | Negative |
| 23 | 10 — 9 | 16 | F | B | Dec. 7 | Y | 3 | E. coli O157 |
| 24 | 10 — 10 | 17 | F | B | Dec. 9 | Y | 3 | E. coli O157 |
| 25 | 10 — 10 | 17 | M | B | Dec. 7 | N | 1 | Negative |
| 26 | 10 — 10 | 16 | M | B | Dec. 6 | Y | 3 | Not done |
Step 5: Find cases systematically and record information
As noted earlier, many outbreaks are brought to the attention of health authorities by concerned healthcare providers or citizens. However, the cases that prompt the concern are often only a small and unrepresentative fraction of the total number of cases. Public health workers must therefore look for additional cases to determine the true geographic extent of the problem and the populations affected by it.
Usually, the first effort to identify cases is directed at healthcare practitioners and facilities — physicians’ clinics, hospitals, and laboratories — where a diagnosis is likely to be made. Investigators may conduct what is sometimes called stimulated or enhanced passive surveillance by sending a letter describing the situation and asking for reports of similar cases. Alternatively, they may conduct active surveillance by telephoning or visiting the facilities to collect information on any additional cases.
In some outbreaks, public health officials may decide to alert the public directly, usually through the local media. In other situations, the media may have already spread the word. For example, in an outbreak of listeriosis in 2002 caused by contaminated sliceable turkey deli meat, announcements in the media alerted the public to avoid the implicated product and instructed them to see a physician if they developed symptoms compatible with the disease in question.(27)
If an outbreak affects a restricted population such as persons on a cruise ship, in a school, or at a work site, and if many cases are mild or asymptomatic and therefore undetected, a survey of the entire population is sometimes conducted to determine the extent of infection. A questionnaire could be distributed to determine the true occurrence of clinical symptoms, or laboratory specimens could be collected to determine the number of asymptomatic cases.
Finally, investigators should ask case-patients if they know anyone else with the same condition. Frequently, one person with an illness knows or hears of others with the same illness.
In some investigations, investigators develop a data collection form tailored to the specific details of that outbreak. In others, investigators use a generic case report form. Regardless of which form is used, the data collection form should include the following types of information about each case.
- Identifying information. A name, address, and telephone number is essential if investigators need to contact patients for additional questions and to notify them of laboratory results and the outcome of the investigation. Names also help in checking for duplicate records, while the addresses allow for mapping the geographic extent of the problem.
- Demographic information. Age, sex, race, occupation, etc. provide the person characteristics of descriptive epidemiology needed to characterize the populations at risk.
- Clinical information. Signs and symptoms allow investigators to verify that the case definition has been met. Date of onset is needed to chart the time course of the outbreak. Supplementary clinical information, such as duration of illness and whether hospitalization or death occurred, helps characterize the spectrum of illness.
- Risk factor information. This information must be tailored to the specific disease in question. For example, since food and water are common vehicles for hepatitis A but not hepatitis B, exposure to food and water sources must be ascertained in an outbreak of the former but not the latter.
- Reporter information. The case report must include the reporter or source of the report, usually a physician, clinic, hospital, or laboratory. Investigators will sometimes need to contact the reporter, either to seek additional clinical information or report back the results of the investigation.
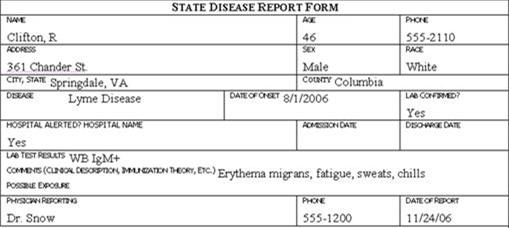
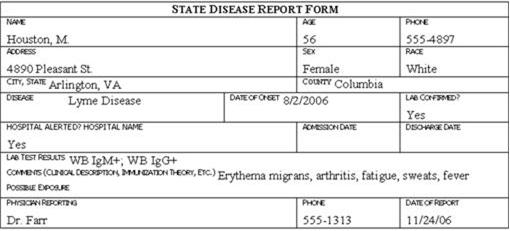
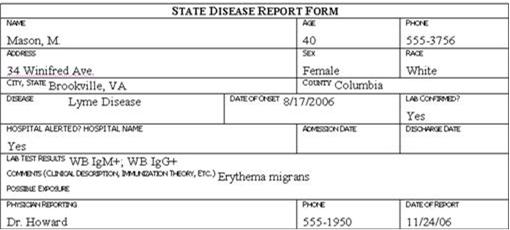
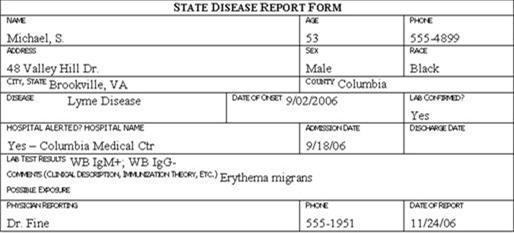
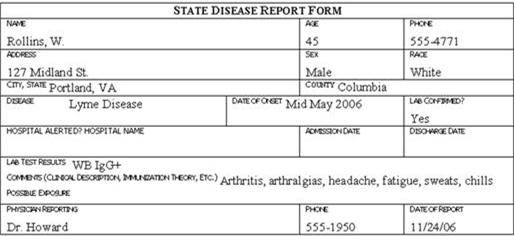
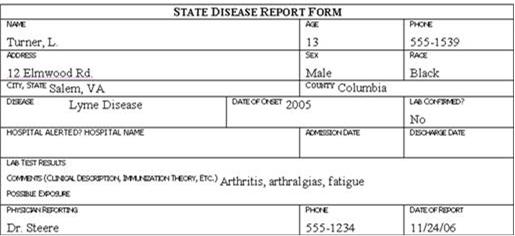
Traditionally, the information described above is collected on a standard case report form, questionnaire, or data abstraction form. Examples of case report forms are shown in Figure 6.1 (in Exercise 6.5). Investigators then abstract selected critical items onto a form called a line listing (See Lesson 2 for more information on line listings. )
An example of the line listing from the 2001 anthrax investigation is shown in Table 6.5.(28) In a line listing, each column represents an important variable, such as name or identification number, age, sex, case classification, etc., while each row represents a different case. New cases are added to a line listing as they are identified. Thus, a line listing contains key information on every case and can be scanned and updated as necessary. Even in the era of computers, many epidemiologists still maintain a handwritten line listing of key data items, and turn to their computers for more complex manipulations and cross-tabulations.
Table 6.5 Line Listing of Demographic, Clinical, and Exposure Characteristics of 22 Cases of Bioterrorism-Related Anthrax—United States, 2001
| Case No. | Onset Date, 2001 | Date of Anthrax Diagnosis by Lab Testing | Statea | Age (yrs) | Sexa | Racea | Occupationa | Case Statusb | Anthrax Presentationb | Outcome | Diagnostic Testsa |
|---|---|---|---|---|---|---|---|---|---|---|---|
| 1 | 9/22 | 10/19 | NY | 31 | F | W | NY Post employee | Suspect | Cutaneous | Alive | Serum IgG reactive |
| 2 | 9/25 | 10/12 | NY | 38 | F | W | NBC anchor assistant | Confirmed | Cutaneous | Alive | Skin biopsy IHC+ / serum IgG reactive |
| 3 | 9/26 | 10/18 | NJ | 39 | M | W | USPS machine mechanic | Suspect | Cutaneous | Alive | Serum IgG reactive |
| 4 | 9/28 | 10/15 | FL | 73 | M | W, H | AMI mailroom worker | Confirmed | Inhalational | Alive | Pleural biopsy IHC+ / serum IgG reactive |
| 5 | 9/28 | 10/18 | NJ | 45 | F | W | USPS mail carrier | Confirmed | Cutaneous | Alive | Skin biopsy IHC+ and PCR+ / serum IgG reac. |
| 6 | 9/28 | 10/12 | NY | 23 | F | W | NBC TV news intern | Suspect | Cutaneous | Alive | Serum IgG reactive |
| 7 | 9/29 | 10/15 | NY | 0.6 | M | W | Child of ABC employee | Confirmed | Cutaneous | Alive | Skin biopsy IHC+ / blood PCR+ |
| 8 | 9/30 | 10/4 | FL | 63 | M | W | AMI photo editor | Confirmed | Inhalational | Dead | Cerebrospinal fluid culture + |
| 9 | 10/1 | 10/18 | NY | 27 | F | W | CBS anchor assistant | Confirmed | Cutaneous | Alive | Skin biopsy IHC+ / serum IgG reactive |
| 10 | 10/14 | 10/19 | PA | 35 | M | W | USPS mail processor | Confirmed | Cutaneous | Alive | Blood culture + / serum IgG reactive |
| 11 | 10/14 | 10/28 | NJ | 56 | F | B | USPS mail processor | Confirmed | Inhalational | Alive | Blood PCR+ / pleural fluid cytology IHC+ / serum IgG reactive |
| 12 | 10/15 | 10/29 | NJ | 43 | F | A | USPS mail processor | Confirmed | Inhalational | Alive | Pleural fluid IHC+ / bronchial biopsy IHC+ / serum IgG reactive |
| 13 | 10/16 | 10/21 | VA | 56 | M | B | USPS mail worker | Confirmed | Inhalational | Alive | Blood culture + |
| 14 | 10/16 | 10/23 | MD | 55 | M | B | USPS mail worker | Confirmed | Inhalational | Dead | Blood culture + |
| 15 | 10/16 | 10/26 | MD | 47 | M | B | USPS mail worker | Confirmed | Inhalational | Dead | Blood culture + |
| 16 | 10/16 | 10/22 | MD | 56 | M | B | USPS mail worker | Confirmed | Inhalational | Alive | Blood culture + |
| 17 | 10/17 | 10/29 | NJ | 51 | F | W | Bookkeeper | Confirmed | Cutaneous | Alive | Skin biopsy IHC+ and PCR+ / serum IgG reactive |
| 18 | 10/19 | 10/22 | NY | 34 | M | W, H | NY Post mail handler | Suspect | Cutaneous | Alive | Skin biopsy IHC+ |
| 19 | 10/22 | 10/25 | VA | 59 | M | W | Government mail processor | Confirmed | Inhalational | Alive | Blood culture + |
| 20 | 10/23 | 10/28 | NY | 38 | M | W | NY Post employee | Confirmed | Cutaneous | Alive | Skin biopsy culture + |
| 21 | 10/25 | 10/30 | NY | 61 | F | A | Hospital supply worker | Confirmed | Inhalational | Dead | Pleural fluid and blood culture + |
| 22 | 11/14 | 11/21 | CT | 94 | F | W | Retired at home | Confirmed | Inhalational | Dead | Blood culture + |
Source: Jernigan DB, Raghunathan PL, Bell BP, Brechner R, Bresnitz EA, Butler JC, et al. Investigation of bioterrorism-related anthrax, United States, 2001: epidemiologic findings. Emerg Infect Dis 2002;8:1019–28.
 Exercise 6.5
Review the six case report forms in Figure 6.1. Create a line listing based on this information.
Figure 6.1
Step 6: Perform descriptive epidemiology
Conceptually, the next step after identifying and gathering basic information on the persons with the disease is to systematically describe some of the key characteristics of those persons. This process, in which the outbreak is characterized by time, place, and person, is called descriptive epidemiology. It may be repeated several times during the course of an investigation as additional cases are identified or as new information becomes available.
This step is critical for several reasons.
- Summarizing data by key demographic variables provides a comprehensive characterization of the outbreak — trends over time, geographic distribution (place), and the populations (persons) affected by the disease.
- From this characterization you can identify or infer the population at risk for the disease.
- The characterization often provides clues about etiology, source, and modes of transmission that can be turned into testable hypotheses (see Step 7).
- Descriptive epidemiology describes the where and whom of the disease, allowing you to begin intervention and prevention measures.
- Early (and continuing) analysis of descriptive data helps you to become familiar with those data, enabling you to identify and correct errors and missing values.
Time
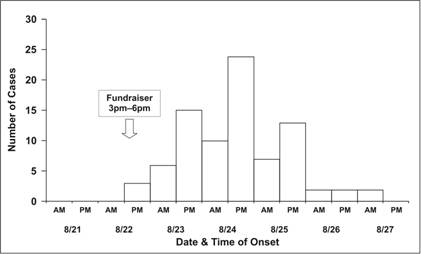
Traditionally, a special type of histogram is used to depict the time course of an epidemic. This graph, called an epidemic curve, or epi curve for short, provides a simple visual display of the outbreak’s magnitude and time trend. The classic epidemic curve, such as the one shown in Figure 6.2a from an outbreak of Salmonella enterica serotype Enteritidis, graphs the number of cases by date or time of onset of illness.
Figure 6.2a Outbreak of SalmonellaEnteritidis Gastroenteritis — Maryland, 2003 (Epidemic Curve by 12-Hour Intervals)
Source Castel AD, Blythe D, Edwards L, Totaro J, Shah D, Moore M. A large outbreak of Salmonella Enteritidis infections associated with crabcakes at a church fundraiser–Maryland, 2003. Presented at 53rd Annual Epidemic Intelligence Service Conference, April 19–23, 2004, Atlanta.
Epidemic curves are a basic investigative tool because they are so informative (see Lesson 6).
- The epi curve shows the magnitude of the epidemic over time as a simple, easily understood visual. It permits the investigator to distinguish epidemic from endemic disease. Potentially correlated events can be noted on the graph.
- The shape of the epidemic curve may provide clues about the pattern of spread in the population, e.g., point versus intermittent source versus propagated.
- The curve shows where you are in the course of the epidemic — still on the upswing, on the down slope, or after the epidemic has ended. This information forms the basis for predicting whether more or fewer cases will occur in the near future.
- The curve can be used for evaluation, answering questions like: How long did it take for the health department to identify a problem? Are intervention measures working?
- Outliers — cases that don’t fit into the body of the curve —may provide important clues.
- If the disease and its incubation period are known, the epi curve can be used to deduce a probable time of exposure and help develop a questionnaire focused on that time period.
Drawing an epidemic curve. To draw an epidemic curve, you first must know the time of onset of illness for each case. For some diseases, date of onset is sufficient. For other diseases, particularly those with a relatively short incubation period, hour of onset may be more suitable (see Lesson 6).
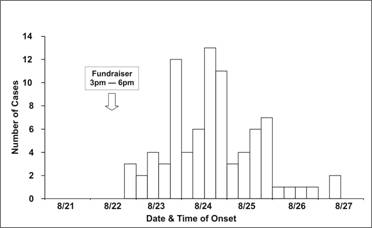
Occasionally, you may be asked to draw an epidemic curve when you don’t know either the disease or its incubation time. In that situation, it may be useful to draw several epidemic curves with different units on the x-axis to find one that best portrays the data. For example, the epidemic curves shown in Figures 6.2b and 6.2c display the same data as in Figure 6.2a; the x-axis is measured in units of 12 hours in Figure 6.2a, 6 hours in Figure 6.2b, and 24 hours (1 day) in 6.2c. Figure 6.2d shows the same data one more time, but with stacks of squares that each represent one case.
Figure 6.2b Outbreak of SalmonellaEnteritidis Gastroenteritis — Maryland, 2003 (Epidemic Curve by 6-Hour Intervals)
Source: Castel AD, Blythe D, Edwards L, Totaro J, Shah D, Moore M. A large outbreak of Salmonella Enteritidis infections associated with crabcakes at a church fundraiser–Maryland, 2003. Presented at 53rd Annual Epidemic Intelligence Service Conference, April 19–23, 2004, Atlanta.
Figure 6.2c Outbreak of SalmonellaEnteritidis Gastroenteritis — Maryland, 2003 (Epidemic Curve by One Day Intervals)
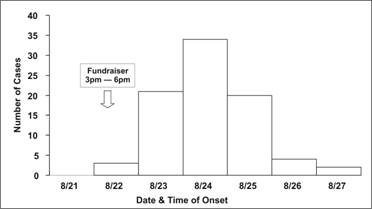
Source: Castel AD, Blythe D, Edwards L, Totaro J, Shah D, Moore M. A large outbreak of Salmonella Enteritidis infections associated with crabcakes at a church fundraiser–Maryland, 2003. Presented at 53rd Annual Epidemic Intelligence Service Conference, April 19–23, 2004, Atlanta.
Figure 6.2d Outbreak of SalmonellaEnteritidis Gastroenteritis — Maryland, 2003 (Epidemic Curve by 6-Hour Intervals)
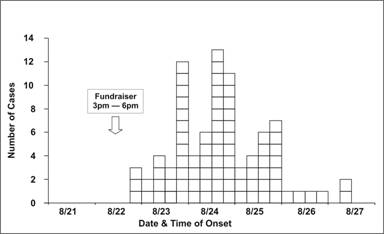
Source: Castel AD, Blythe D, Edwards L, Totaro J, Shah D, Moore M. A large outbreak of Salmonella Enteritidis infections associated with crabcakes at a church fundraiser–Maryland, 2003. Presented at 53rd Annual Epidemic Intelligence Service Conference, April 19–23, 2004, Atlanta.
Interpreting an epidemic curve. The first step in interpreting an epidemic curve is to consider its overall shape. The shape of the epidemic curve is determined by the epidemic pattern (for example, common source versus propagated), the period of time over which susceptible persons are exposed, and the minimum, average, and maximum incubation periods for the disease.
An epidemic curve that has a steep upslope and a more gradual down slope (a so-called log-normal curve) is characteristic of a point-source epidemic in which persons are exposed to the same source over a relative brief period. In fact, any sudden rise in the number of cases suggests sudden exposure to a common source one incubation period earlier (Figure 6.3).
In a point-source epidemic, all the cases occur within one incubation period. If the duration of exposure is prolonged, the epidemic is called a continuous common-source epidemic, and the epidemic curve has a plateau instead of a peak. An intermittent common-source epidemic (in which exposure to the causative agent is sporadic over time) usually produces an irregularly jagged epidemic curve reflecting the intermittence and duration of exposure and the number of persons exposed. In theory, a propagated epidemic — one spread from person-to-person with increasing numbers of cases in each generation — should have a series of progressively taller peaks one incubation period apart, but in reality few produce this classic pattern.
Figure 6.3 Typical Epi Curves for Different Types of Spread
Epicurves
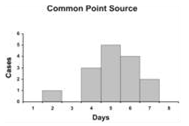
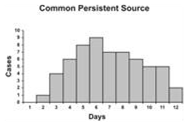
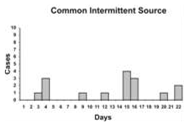
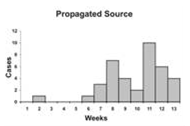
Adapted from: European Programme for Intervention Epidemiology Training [Internet]. Solna, Sweden: Smittskyddsinstitutet [updated 2004 Sep 27; cited 2006 Sep 22].
Figure 6.4 Number of Cases of Acute Hemorrhagic Conjunctivitis, By Month and Week of Report — Puerto Rico, August 7–October 30, 2003
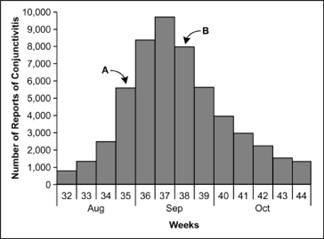
Adapted from: Acute hemorrhagic conjunctivitis outbreak caused by Coxsackievirus A24–Puerto Rico, 2003. MMWR 2004;53:632–4.
As noted above, the epidemic curve shows where you are in the natural course of the epidemic. Consider the epidemic curve of acute hemorrhagic conjunctivitis in Puerto Rico, shown in Figure 6.4. If you only had data through Week 35, that is, through point A, you might conclude that the outbreak is still on the upswing, with more cases to come. On the other hand, if you had data through point B, you might judge that the outbreak has peaked and may soon be over.
The cases that stand apart may be just as informative as the overall pattern. An early case may represent a background or unrelated case, a source of the epidemic, or a person who was exposed earlier than most of the cases (for example, the cook who tasted a dish hours before bringing it to the big picnic). Similarly, late cases may represent unrelated cases, cases with long incubation periods, secondary cases, or persons exposed later than most others (for example, someone eating leftovers). On the other hand, these outlying cases sometimes represent miscoded or erroneous data. All outliers are worth examining carefully because if they are part of the outbreak, they may have an easily identifiable exposure that may point directly to the source.
In a point-source epidemic of a known disease with a known incubation period, the epidemic curve can be used to identify a likely period of exposure. Knowing the likely period of exposure allows you to ask questions about the appropriate period of time so you can identify the source of the epidemic.
To identify the likely period of exposure from an epidemic curve of an apparent point source epidemic:
- Look up the average and minimum incubation periods of the disease. This information can be found on disease fact sheets available on the Internet or in the Control of Communicable Diseases Manual.(29)
- Identify the peak of the outbreak or the median case and count back on the x-axis one average incubation period. Note the date.
- Start at the earliest case of the epidemic and count back the minimum incubation period, and note this date as well.
Ideally, the two dates will be similar, and represent the probable period of exposure. Since this technique is not precise, widen the probable period of exposure by, say, 20% to 50% on either side of these dates, and then ask about exposures during this widened period in an attempt to identify the source.
In a similar fashion, if the time of exposure and the times of onset of illness are known but the cause has not yet been identified, the incubation period can be estimated from the epidemic curve. Subtract the time of onset of the earliest cases from the time of exposure to estimate the minimum incubation period. Subtract the time of onset of the median case from the time of exposure to estimate the median incubation period. These incubation periods can be compared with a list of incubation periods of known diseases to narrow the possibilities.
EXAMPLE: Interpreting an Epidemic Curve
Consider, for example, the outbreak of hepatitis A illustrated by the epidemic curve in Figure 6.5. The incubation period for hepatitis A ranges from 15 to 50 days (roughly 2 to 7 weeks), with an average incubation period of 28–30 days (roughly one month). Because cases can occur from 15 to 50 days after exposure, all cases from a point source exposure should occur within a span of 50 – 15 = 35 days.
Figure 6.5 Hepatitis A from Sub Shop — Massachusetts, 2001
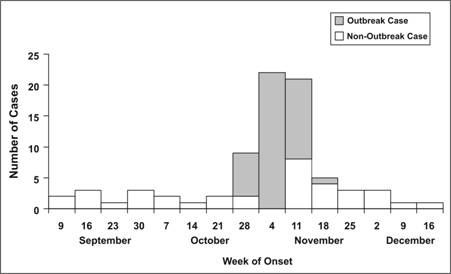
Adapted from: Foodborne transmission of hepatitis A — Massachusetts, 2001. MMWR 2003;52:565–7.
Is this epidemic curve consistent with a point-source epidemic? (That is, do all of the cases occur with one incubation period?)
Yes. The date of onset of the first case was during the week of October 28. The date of onset of the last known case was during the week of November 18, less than one month later. All of the cases occur within the range of incubation periods expected for a point source exposure. Therefore, the epidemic curve can be used to identify the likely period of exposure.
What is the peak of the outbreak or the median date of onset?
Both the peak of the outbreak and the median case occurred during the week of November 4.
When is the likely date(s) of exposure, based on one average incubation period prior to the peak (median date) of the outbreak?
Since both the peak and the median of the outbreak occurred during the week of November 4, the most likely period of exposure was a month earlier, in early October.
When is the beginning of the outbreak?
The earliest case occurred during the week of October 28.
When is the likely dates of exposure, based on the minimum incubation period before the first case?
Subtracting 2 weeks from the week of October 28 points to the week of October 14.
Thus you would look for exposures during the weeks of October 7 and 14, plus or minus a few days. This turned out to be the exact period during which a restaurant employee, diagnosed with hepatitis A in mid-October, would have been shedding virus while still working. In summary, the graph reflects an outbreak (number of cases clearly in excess of usual) beginning during the week of October 28, peaking during the week of November 4, and ending during the week of November 18. Based on these data and knowledge of the incubation period of hepatitis A, the period of exposure was probably in early to mid-October.
 Exercise 6.6
An outbreak of an acute respiratory disease, coccidioidomycosis, occurred among volunteers, group leaders, and archaeologists who began working at a Native American archaeological site in Utah on June 18.(30)
- Using the dates of onset listed below, draw an epidemic curve. Download Graph paper.
Case # Date of Onset 1 6/28 2 6/28 3 6/29 4 6/29 5 6/29 6 6/29 7 6/29 8 6/30 9 7/1 10 7/1 - The average incubation period for coccidioidomycosis is 12 days, with a minimum incubation period of 7 days. Using your epidemic curve and the average and minimum incubation periods for coccidioidomycosis, identify the likely exposure period.
Place
Assessment of an outbreak by place not only provides information on the geographic extent of a problem, but may also demonstrate clusters or patterns that provide important etiologic clues. A spot map is a simple and useful technique for illustrating where cases live, work, or may have been exposed.
Some spot maps indicate each patient’s residence. If the map shows a cluster or other pattern (such as cases along a road), the investigator must consider possible explanations — perhaps water supplies, wind currents, or proximity to a restaurant or grocery. A spot map, like that used by John Snow in London in 1854 (see Lesson 1, Figure 1.1), can give clues about mode of spread.(31) For example, clustering of cases in a wing of a nursing home is consistent with either a focal source or person-to-person spread, whereas scattering of cases throughout the facility is more consistent with a widely disseminated vehicle or a source common to the residents that is not associated with room assignment, such as a common dining hall or water supply. In an outbreak of pneumococcal pneumonia in a nursing home in New Jersey, cases were more common in the north wing than in the south wing (Figure 6.6). Nursing home staff did report that the 2 residents of the south wing who developed pneumonia did spend much of their time in the north wing.(32)
Figure 6.6 Cases of Pneumonia by Room, Nursing Home A — New Jersey, 2001
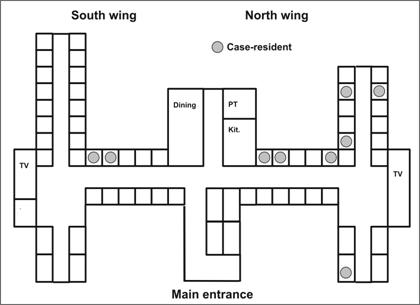
Adapted from: Tan C. A preventable outbreak of pneumococcal pneumonia among unvaccinated nursing home residents in New Jersey during 2001. Infect Control Hosp Epidemiol 2003;24:848–52.
Often, a spot map by site of presumed exposure is more informative than one by residence. Figure 6.7 shows the location of staff in two offices in the U.S. Senate’s Hart Building who had nasal swabs positive for B. anthracis after an envelope containing anthrax spores was opened in their presence.(33)
To look for clustering in an outbreak of surgical wound infections in a hospital, cases may be plotted by operating room, recovery room, and ward room. In studying “sick-building syndrome” and other disorders related to air-flow patterns in buildings, cases should be plotted by work location. A spot map may even plot sites of recreational or other outdoor exposures.
Figure 6.7 Desk Locations of Persons with Nasal Swabs Positive for Bacillus anthracis, Hart Building — Washington, DC, 2001
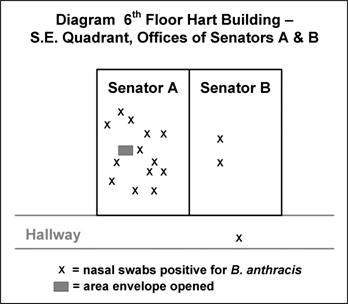
Adapted from: Lukacs SL, Hsu V, Harper S, Handzel T, Hayslett J, Khabbaz R,,et al. Anthrax outbreak averted: public health response to a contaminated envelope on Capital Hill–Washington, DC, 2001. Presented at 51st Annual Epidemic Intelligence Service Conference, April 22–26, 2004, Atlanta.
Spot maps are useful for demonstrating cases within a geographic area, but they do not take the size of the underlying population into account. To compare incidence between different areas with different population densities, an area map showing area-specific rates is preferable. Figure 6.8 shows the number of cases of human granulocytic ehrlichiosis by county in Wisconsin during 1996–1998.(34) The most cases occurred in Washburn (n=21) and Chippewa (n=17) Counties. By dividing the number of cases by the size of the population, county-specific rates of ehrlichiosis can be calculated (Figure 6.9). While Jackson (n=11) and Rusk (n=9) Counties had fewer cases than Chippewa, their populations are much smaller, and they turned out to have higher rates of disease.
Figure 6.8 Cases of Human Granulocytic Ehrlichiosis by County — Wisconsin, May 1996–December 1998
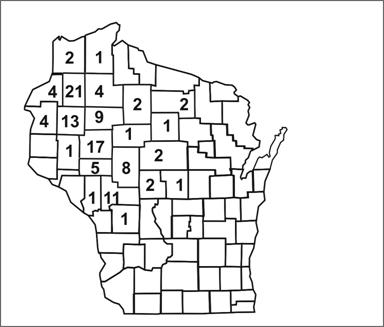
Source Ramsey AH, Belongia EA, Gale CM, Davis JP. Outcomes of treated human granulocytic ehrlichiosis cases. Emerg Infect Dis 2002;8:398-401.
Figure 6.9 Rates of Human Granulocytic Ehrlichiosis by County — Wisconsin, May 1996–December 1998
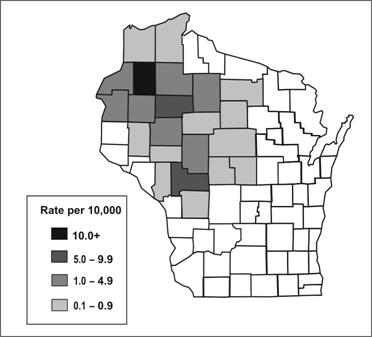
Source: Ramsey AH, Belongia EA, Gale CM, Davis JP. Outcomes of treated human granulocytic ehrlichiosis cases. Emerg Infect Dis 2002;8:398-401.
Person
Characterization of the outbreak by person provides a description of whom the case-patients are and who is at risk. Person characteristics that are usually described include both host characteristics (age, race, sex, and medical status) and possible exposures (occupation, leisure activities, and use of medications, tobacco, and drugs). Both of these influence susceptibility to disease and opportunities for exposure.
The two most commonly described host characteristics are age and sex because they are easily collected and because they are often related to exposure and to the risk of disease. Depending on the outbreak, occupation, race, or other personal characteristics specific to the disease under investigation and the setting of the outbreak may also be important. For example, investigators of an outbreak of hepatitis B might characterize the cases by intravenous drug use and sexual contacts, two of the high risk exposures for that disease. Investigators of a school-based gastroenteritis outbreak might describe occurrence by grade or classroom, and by student versus teacher or other staff.
Early in an investigation, investigators may restrict the descriptive epidemiology to numbers of cases. However, in many circumstances the investigators also calculate rates (number of cases divided by the population or number of people at risk). Numbers indicate the burden of disease and are useful for planning and service delivery. Rates are essential for identifying groups with elevated risk of disease.
Summarizing by time, place, and person
After characterizing an outbreak by time, place, and person, it is useful to summarize what you know. For example, during an investigation of an outbreak of Legionnaires’ disease in Louisiana, members of the investigative team discussed what they knew based on the descriptive epidemiology.(35) Specifically, the epidemic curve indicated that the outbreak was basically over, because no new case had been reported in the previous two weeks. The affected population had a greater proportion of persons who were black, female, young, and less likely to smoke than persons in a typical Legionnaires’ outbreak. There appeared to be no clustering by either residence or worksite, and no connection with exposure to the town’s cooling towers. Thus, the investigators were forced to develop new hypotheses about a source of Legionnaires’ disease to explain this outbreak.
Textbox module not selected or not found.Step 7: Develop hypotheses
Although the next conceptual step in an investigation is formulating hypotheses, in reality, investigators usually begin to generate hypotheses at the time of the initial telephone call. Depending on the outbreak, the hypotheses may address the source of the agent, the mode (and vehicle or vector) of transmission, and the exposures that caused the disease. The hypotheses should be testable, since evaluating hypotheses is the next step in the investigation.
In an outbreak context, hypotheses are generated in a variety of ways. First, consider what you know about the disease itself: What is the agent’s usual reservoir? How is it usually transmitted? What vehicles are commonly implicated? What are the known risk factors? In other words, by being familiar with the disease, you can, at the very least, “round up the usual suspects.”
Another useful way to generate hypotheses is to talk to a few of the case-patients, as discussed in Step 3. The conversations about possible exposures should be open-ended and wide-ranging, not necessarily confined to the known sources and vehicles. In some challenging investigations that yielded few clues, investigators have convened a meeting of several case-patients to search for common exposures. In addition, investigators have sometimes found it useful to visit the homes of case-patients and look through their refrigerators and shelves for clues to an apparent foodborne outbreak.
Just as case-patients may have important insights into causes, so too may the local health department staff. The local staff know the people in the community and their practices, and often have hypotheses based on their knowledge.
The descriptive epidemiology may provide useful clues that can be turned into hypotheses. If the epidemic curve points to a narrow period of exposure, what events occurred around that time? Why do the people living in one particular area have the highest attack rate? Why are some groups with particular age, sex, or other person characteristics at greater risk than other groups with different person characteristics? Such questions about the data may lead to hypotheses that can be tested by appropriate analytic techniques.
Textbox module not selected or not found.Given recent concerns about bioterrorism, investigators should consider intentional dissemination of an infectious or chemical agent when trying to determine the cause of an outbreak. An intentional act, one with either terrorist or criminal intent, should be considered under a variety of circumstances listed in Table 6.6. Investigators of an outbreak of salmonellosis in The Dalles, Oregon, were stumped when they were able to implicate salad bars in several local restaurants, but could not identify any common ingredients or distribution system.(36) A year later, a member of a local cult admitted that the cult had intentionally contaminated the salads bars with Salmonellaorganisms. The lesson learned is that when the epidemiology does not fit the usual or natural patterns of transmission, investigators should think about intentional modes of transmission.
Table 6.6 Epidemiologic Clues to Bioterrorism
- Single case of disease caused by an uncommon agent (e.g., glanders, smallpox, viral hemorrhagic fever, inhalational or cutaneous anthrax) without adequate epidemiologic explanation
- Unusual, atypical, genetically engineered, or antiquated strain of an agent (or antibiotic-resistance pattern)
- Higher morbidity and mortality in association with a common disease or syndrome or failure of such patients to respond to usual therapy
- Unusual disease presentation (e.g., inhalational anthrax or pneumonic plague)
- Disease with an unusual geographic or seasonal distribution (e.g., tularemia in a non-endemic area, influenza in the summer)
- Stable endemic disease with an unexplained increase in incidence (e.g., tularemia, plague)
- Atypical disease transmission through aerosols, food, or water, in a mode suggesting deliberate sabotage (i.e., no other physical explanation)
- No illness in persons who are not exposed to common ventilation systems (have separate closed ventilation systems) when illness is seen in persons in close proximity who have a common ventilation system
- Several unusual or unexplained diseases coexisting in the same patient without any other explanation
- Unusual illness that affects a large, disparate population (e.g., respiratory disease in a large population may suggest exposure to an inhalational pathogen or chemical agent)
- Illness that is unusual (or atypical) for a given population or age group (e.g., outbreak of measles-like rash in adults)
- Unusual pattern of death or illness among animals (which may be unexplained or attributed to an agent of bioterrorism) that precedes or accompanies illness or death in humans
- Unusual pattern of death or illness among humans (which may be unexplained or attributed to an agent of bioterrorism) that precedes or accompanies illness or death in animals
- Ill persons who seek treatment at about the same time (point source with compressed epidemic curve)
- Similar genetic type among agents isolated from temporally or spatially distinct sources
- Simultaneous clusters of similar illness in noncontiguous areas, domestic or foreign
- Large number of cases of unexplained diseases or deaths
Source: Treadwell TA, Koo D, Kuker K, Khan AS. Epidemiologic clues to bioterrorism. Public Health Reports 2003; 118:92–8.
Relative and attributable risk.Commonly, the investigator compares the attack rate in the exposed group to the attack rate in the unexposed group to measure the association between the exposure (e.g., the food item) and disease. This is called the risk ratio or the relative risk. When the attack rate for the exposed group is the same as the attack rate for the unexposed group, the relative risk is equal to 1.0, and the exposure is said not to be associated with disease. The greater the difference in attack rates between the exposed and unexposed groups, the larger the relative risk, and the stronger the association between exposure and disease.
Table 6.7 includes data from an investigation of an outbreak of Salmonella Typhimurium gastroenteritis following a company’s holiday banquet in December 2003.(40) Approximately 135 persons attended the party, and of 116 who were interviewed, 57 (49%) met the case definition. Food-specific attack rates for those who did and did not eat each of 9 items served only at this banquet are presented.
Scan the column of attack rates among those who ate the specified items and consider the three criteria listed on the previous page. Which item shows the highest attack rate? Is the attack rate low among persons not exposed to that item? Were most of the 57 case-patients exposed to that food item?
Table 6.7 Attack Rates By Items Served at Company A’s Holiday Banquet — Virginia, December 2003
| Food Items Served | Number of Persons who ATE Specified Food | Number of Persons who DID NOT EAT Specified Food | Risk Ratio | ||||||
|---|---|---|---|---|---|---|---|---|---|
| Ill | Not Ill | Total | Attack Rate | Ill | Not Ill | Total | Attack Rate | ||
| Beef | 53 | 28 | 81 | 65% | 4 | 31 | 35 | 11% | 5.7 |
| Ravioli | 43 | 35 | 78 | 55% | 14 | 24 | 38 | 37% | 1.5 |
| Cajun sauce* | 19 | 11 | 30 | 63% | 37 | 48 | 85 | 44% | 1.5 |
| Pesto cream* | 37 | 29 | 66 | 56% | 19 | 30 | 49 | 39% | 1.4 |
| California rolls* | 21 | 14 | 35 | 60% | 34 | 44 | 78 | 44% | 1.4 |
| Mushrooms* | 32 | 26 | 58 | 55% | 24 | 31 | 55 | 44% | 1.3 |
| Broccoli* | 34 | 30 | 64 | 53% | 22 | 29 | 51 | 43% | 1.2 |
| Carrots* | 34 | 30 | 64 | 53% | 23 | 28 | 51 | 43% | 1.2 |
| Potatoes* | 39 | 41 | 80 | 49% | 17 | 17 | 34 | 50% | 1.0 |
* Excludes 1 or more persons with indefinite history of consumption of that food.
Source: Jani AA, Barrett E, Murphy J, Norton D, Novak C, Painter J, Toney D. A steamship full of trouble: an outbreak of Salmonella Typhimurium DT 104 gastroenteritis at a holiday banquet–Virginia, 2003. Presented at 53rd Annual Epidemic Intelligence Service Conference, April 19–23, 2004, Atlanta.
Beef, which had the highest attack rate among those who ate it, the lowest attack rate among those who did not eat it, and could account for almost all (53 of 57) of the cases, was indeed the culprit. The data showing the relationship between an exposure and disease are often displayed in a two-by-two table. The following two-by-two table shows the data for beef and gastroenteritis.
Table 6.8 Risk of Gastroenteritis By Consumption of Beef — Virginia, December 2003
| Ill | Not Ill | Total | Attack Rate (Risk) | ||
|---|---|---|---|---|---|
| Ate beef? | Yes | 53 | 28 | 81 | 65.4% |
| No | 4 | 31 | 35 | 11.4% | |
| Total | 57 | 59 | 116 | 49.1% |
Risk ratio = 65.4 ⁄ 11.4 = 5.7
Proportion of cases exposed = 53 ⁄ 57 = 93.0%
Population attributable risk percent = (49.1 − 11.4) ⁄ 49.1 = 76.7%
Source: Jani AA, Barrett E, Murphy J, Norton D, Novak C, Painter J, Toney D. A steamship full of trouble: an outbreak of Salmonella Typhimurium DT 104 gastroenteritis at a holiday banquet –Virginia, 2003. Presented at 53rd Annual Epidemic Intelligence Service Conference, April 19–23, 2004, Atlanta.
The risk ratio is calculated as the ratio of the attack rates or risks, i.e., 65.4% divided by 11.4%, which equals 5.7. This risk ratio indicates that persons who ate the beef were 5.7 times more likely to become ill than those who did not eat the beef. Textbox module not selected or not found.
Considering the third criterion listed earlier, notice that almost all (53 out of 57) of the cases could be accounted for by the beef. Some investigators use a more quantitative approach and calculate a population attributable risk percent for each food. The population attributable risk percent describes the proportion of illness in the entire study population that could be attributable to a given exposure, assuming that those who became ill in the unexposed group and a similar proportion in the exposed group must be attributable to something else. The population attributable risk percent may actually be an underestimate in many outbreaks, since it does not take into account such common occurrences as cross-contamination of foods or sampling of a spouse’s dish. The population attributable risk percent for beef was 76.7% (see Table 6.8), much higher than that for any other food.
Statistical significance testing. When an exposure is found to have a relative risk different from 1.0, many investigators calculate a chi-square or other test of statistical significance to determine the likelihood of finding an association as large or larger on the basis of chance alone. A detailed description of statistical testing is beyond the scope of this lesson, but the following text presents some key features and formulas.
To test an association for statistical significance, assume first that the exposure is not related to disease, i.e., the relative risk (RR) equals 1.0. This assumption is known as the null hypothesis. The alternative hypothesis, which will be adopted if the null hypothesis proves to be implausible, is that exposure is associated with disease. Next, compute a measure of association, such as a risk ratio or odds ratio. Then calculate a chi-square or other statistical test. This test indicates the probability of finding an association as strong as or stronger than the one you have observed if the null hypothesis were really true, that is, if in reality the exposure being tested was not related to the disease. This probability is called the p-value. A very small p-value means that the observed association occurs only rarely if the null hypothesis is true. If the p-value is smaller than some cutoff that has been specified in advance, commonly 0.05 or 5%, you discard or reject the null hypothesis in favor of the alternative hypothesis.
Table 6.9 shows the standard notation for a two-by-two table.
Table 6.9 Standard Notation of a Two-By-Two Table
| Ill | Well | Total | Attack Rate (Risk) | |
|---|---|---|---|---|
| Total | a+c=V1 | b+d=V2 | T | V1 ⁄ T |
| Exposed | a | b | a+b = H1 | a ⁄ a+b |
| Unexposed | c | d | c+d = H0 | c ⁄ c+d |
The most common statistical test for data in a two-by-two table from an outbreak is the chi-square test. To apply this test, calculate the chi-square statistic, then look up its corresponding p-value in a table of chi-squares, such as Table 6.10. Since a two-by-two table has 1 degree of freedom, a chi-square larger than 3.84 corresponds to a p-value smaller than 0.05. This means that if you planned to reject the null hypothesis if the p-value is less than 0.05, you can do so if your value for chi-square is greater than 3.84. Recognize, however, that the chi-square and similar tests are guides to help you make a decision about a hypothesis. Whichever decision you make, you may be right or you may be wrong. You could calculate a p-value that is not less than 0.05 and consequently fail to reject the null hypothesis, which may turn out to be true. This often occurs when a study has relatively few people. The opposite can also occur — a p-value less than 0.05 can actually be a chance finding rather than the true explanation of the outbreak.
Table 6.10 Table of Chi-Squares
| Degrees of Freedom |
Probability | ||||||
|---|---|---|---|---|---|---|---|
| .50 | .20 | .10 | .05 | .02 | .01 | .001 | |
| 1 | .455 | 1.642 | 2.706 | 3.841 | 5.412 | 6.635 | 10.827 |
| 2 | 1.386 | 3.219 | 4.605 | 5.991 | 7.824 | 9.210 | 13.815 |
| 3 | 2.366 | 4.642 | 6.251 | 7.815 | 9.837 | 11.345 | 16.268 |
| 4 | 3.357 | 5.989 | 7.779 | 9.488 | 11.668 | 13.277 | 18.465 |
| 5 | 4.351 | 7.289 | 9.236 | 11.070 | 13.388 | 15.086 | 20.517 |
| 10 | 9.342 | 13.442 | 15.987 | 18.307 | 21.161 | 23.209 | 29.588 |
| 15 | 14.339 | 19.311 | 22.307 | 24.996 | 28.259 | 30.578 | 37.697 |
| 20 | 19.337 | 25.038 | 28.412 | 31.410 | 35.020 | 37.566 | 43.315 |
| 25 | 24.337 | 30.675 | 34.382 | 37.652 | 41.566 | 44.314 | 52.620 |
| 30 | 29.336 | 36.250 | 40.256 | 43.773 | 47.962 | 50.892 | 59.703 |
Consider the gastroenteritis and beef consumption data presented in Table 6.8. The relative risk is 5.7, which most epidemiologists would deem a “strong” association between exposure and disease. In addition, the p-value is exceedingly small, less than 0.001, and far less than the commonly used cutoff of 0.05. So the investigators rejected the null hypothesis (that beef was not associated with illness) and adopted the alternative hypothesis (that beef was indeed associated with illness). In this outbreak, the association between eating beef at the banquet and gastroenteritis was both strong (RR=5.7) and statistically significant (p < 0.001).
The chi-square test works well if the number of people in the study is greater than about 30. For smaller studies, a test called the Fisher Exact Test may be more appropriate. Because the Fisher Exact Test is tedious to calculate, let Epi Info or another computer program perform the calculations for you.
Confidence intervals. An alternative to calculating a p-value is calculating a confidence interval. A 95% confidence interval, the interval used most commonly by epidemiologists, corresponds to a p=0.05 cut-off. In non-technical terms, a confidence interval for a risk ratio is the range of values of the risk ratio consistent with the data in a study. A wide confidence interval indicates that the study is consistent with a wide range of values, i.e., the study is not very precise in describing the strength of the association (risk ratio) between exposure and disease. A narrow confidence interval indicates that the risk ratio is fairly precise. Consider again the gastroenteritis data in Table 6.8. The 95% confidence interval for the risk ratio of 5.7 ranged from 2.2 to 14.6. This confidence interval indicates that the study is consistent with risk ratios for the beef/gastroenteritis association in that range.
Because a confidence interval provides more information than a p-value does, many medical and epidemiologic journals now prefer confidence intervals to p-values. However, in the outbreak setting, the difference may be irrelevant. If the objective of an outbreak investigation is to identify the culprit such as a contaminated food, a relative risk and p-value may do just as well as a relative risk and confidence interval.
Case-control studies
A cohort study is feasible only when the population is well defined and can be followed over a period of time. However, in many outbreak settings, the population is not well defined and speed of investigation is important. In such settings, the case-control study becomes the study design of choice.
In a case-control study, the investigator asks both case-patients and a comparison group of persons without disease (“controls”) about their exposures. Using the information about disease and exposure status, the investigator then calculates an odds ratio to quantify the relationship between exposure and disease. Finally, a p-value or confidence interval is calculated to assess statistical significance.
Choosing controls. When designing a case-control study, one of the most important decisions is deciding who the controls should be. The controls must not have the disease being studied, but should represent the population in which the cases occurred. In other words, they should be similar to the cases except that they don’t have the disease. The controls provide the level of exposure you would expect to find among the case-patients if the null hypothesis were true. If exposure is much more common among the case-patients than among the controls, i.e., the observed exposure among case-patients is greater than expected exposure provided by the controls, then exposure is said to be associated with illness.
In practice, choosing who the most appropriate control group is may be quite difficult. In addition, investigators must consider logistical issues, such as how to contact potential controls, gain their cooperation, ensure that they are free of disease, and obtain appropriate exposure data from them. In a community outbreak, a random sample of the healthy population may, in theory, be the best control group. In practice, however, persons in a random sample may be difficult to contact and enroll. Nonetheless, many investigators attempt to enroll such “population-based” controls through dialing of random telephone numbers in the community or through a household survey.
Other common control groups consist of:
- Neighbors of case-patients,
- Patients from the same physician practice or hospital who do not have the disease in question,
- Friends of case-patients.
While controls from these groups may be more likely to participate in the study than randomly identified population-based controls, they may not be as representative of the population. If the control group is systematically different from the case group in certain ways, a true association between exposure and disease may be missed or a spurious association may be observed between a non-causal exposure and disease. A systematic difference between cases and controls that results in a mistaken estimate of the association between exposure and disease is called a bias.
When designing a case-control study, you must consider a variety of other issues about controls, including how many to use. Sample size formulas are available to help you make this decision. In general, the more subjects (case-patients and controls) in a study, the easier it will be to find a statistically significant association.
Often, the number of case-patients that can be enrolled in a study is limited by the size of the outbreak. For example, in a hospital, four or five cases may constitute an outbreak. Fortunately, potential controls are usually plentiful. In an outbreak of 50 or more cases, one control per case will usually suffice. In smaller outbreaks, you might use two, three, or four controls per case. Including more than four controls per case is rarely worth the effort in terms of increasing the statistical power of your investigation.
As an example, consider again the outbreak of Legionnaires’ disease that occurred in Louisiana described at the end of Step 6. Investigators enrolled 27 case-patients into a case-control study. They also enrolled two controls per case, a total of 54 controls. Using descriptive epidemiology, the investigators did not see any connection with the town’s various cooling towers. Using analytic epidemiology, the investigators determined quantitatively that case-patients and controls were about equally exposed to cooling towers. However, case-patients were far more likely to shop at a particular grocery store, as shown in the following two-by-two table.35
Table 6.11 Exposure to Grocery Store A Among Cases and Controls, Legionellosis Outbreak — Louisiana, 1990
| Cases | Controls | Total | |
|---|---|---|---|
| Exposed | 25 | 28 | 53 |
| Unexposed | 2 | 26 | 28 |
Data Source: Mahoney FJ, Hoge CW, Farley TA, Barbaree JM, Breiman RF, Benson RF, McFarland LM. Communitywide outbreak of Legionnaires’ disease associated with a grocery store mist machine. J Infect Dis 1992;165:736–9.
Odds ratios. In most case-control studies, the population is not well defined, and the total number of people exposed (or unexposed) to a suspected vehicle or source is not known. Without a proper denominator, attack rates cannot be calculated. In the example above, since the investigators did not know how many community residents did or did not shop at Grocery Store A, they could not calculate attack rates or a risk ratio. For a case-control study, the measure of association of choice is the odds ratio. Fortunately, for a rare disease such as legionellosis and most other outbreak-associated diseases, the odds ratio from a case-control study approximates the relative risk that would have been found if a cohort study had been feasible.
The odds ratio for Grocery Store A is calculated as:
25 × 26 ⁄ 28 × 2 = 11.6
An odds ratio of 11 is quite large, indicating that shopping at Grocery Store A was strongly associated with developing legionellosis. These data would seem to indicate that persons exposed to Grocery Store A had 11.6 times the odds of developing legionellosis than persons not exposed to that store.
To test the statistical significance of this finding, a chi-square test can be computed using the formula shown earlier.
For Grocery Store A, the chi-square is:
 53 × 28 × 27 × 54
= 28,579,716 ⁄ 2,163,672
= 13.02
Referring to Table 6.10, a chi-square of 13.02 corresponds to a p-value less than 0.001. A p-value this small indicates that the null hypothesis is highly improbable, and the investigators rejected the null hypothesis. The 95% confidence interval ranged from 2.3 to 78.7. Although this confidence interval is quite wide and includes a wide range of values compatible with the data in the study, it does not include the null hypothesis value of 1.0.
 Exercise 6.7
You are called to help investigate a cluster of 17 persons who developed brain cancer in an area over the past couple of years. Most, perhaps all, used cell phones. Which study design would you choose to investigate a possible association between cell phone use and brain cancer?
 Exercise 6.8
Investigators conducted a case-control study of histoplasmosis among industrial plant workers in Nebraska.(40) The following table shows the number of case-patients and controls who worked in Building X, near a recently excavated site.
| Cases | Controls | Total | |
|---|---|---|---|
| Building X | 15 | 8 | 23 |
| Other Building | 7 | 23 | 30 |
| Total | 22 | 31 | 53 |
- What is the appropriate measure of association?
- Calculate this measure.
- The chi-square is 9.41, and the 95% confidence interval is 1.6—25.1. How would you interpret your results?
 Exercise 6.9
Consider the following data from an outbreak of gastroenteritis among college football players.(42) At which meal do you think the critical exposure occurred?
| Meal | Ate Meal | Did Not Eat Meal | ||||
|---|---|---|---|---|---|---|
| #Ill | (% Ill) | Total | #Ill | (% Ill) | Total | |
| 9/18 Breakfast | 9 | (90) | 10 | 45 | (46) | 98 |
| 9/18 Lunch | 50 | (62) | 81 | 4 | (15) | 27 |
| 9/18 Dinner | 45 | (52) | 87 | 9 | (43) | 21 |
| 9/18 Late dinner | 34 | (54) | 63 | 20 | (44) | 45 |
| 9/19 Breakfast | 42 | (49) | 85 | 12 | (52) | 23 |
| 9/19 Lunch | 39 | (51) | 76 | 15 | (47) | 32 |
Step 9: Reconsider, refine, and re-evaluate hypotheses
Unfortunately, analytic studies sometimes are unrevealing. This is particularly true if the hypotheses were not well founded at the outset. It is an axiom of field epidemiology that if you cannot generate good hypotheses (for example, by talking to some case-patients or local staff and examining the descriptive epidemiology and outliers), then proceeding to analytic epidemiology, such as a case-control study, is likely to be a waste of time.
When analytic epidemiology is unrevealing, rethink your hypotheses. Consider convening a meeting of the case-patients to look for common links or visiting their homes to look at the products on their shelves. Consider new vehicles or modes of transmission.
An investigation of an outbreak of SalmonellaMuenchen in Ohio illustrates how a reexamination of hypotheses can be productive. In that investigation, a case-control study failed to implicate any plausible food source as a common vehicle. Interestingly, all case-households but only 41% of control households included persons aged 15–35 years. The investigators thus began to consider vehicles of transmission to which young adults were commonly exposed. By asking about drug use in a second case-control study, the investigators implicated marijuana as the likely vehicle. Laboratory analysts subsequently isolated the outbreak strain of S.Muenchen from several samples of marijuana provided by case-patients.(43)
Even when an analytic study identifies an association between an exposure and disease, the hypothesis may need to be honed. For example, in the investigation of Legionnaires’ disease (Table 6.11), what about Grocery Store A linked it to disease? The investigators asked case-patients and controls how much time they spent in the store and where they went in the store. Using the epidemiologic data, the investigators were able to implicate the ultrasonic mist machine that sprayed the fruits and vegetables. This association was confirmed in the laboratory, where the outbreak subtype of the Legionnaires’ disease bacillus was isolated from the water in the mist machine’s reservoir.(35)
Sometimes a more specific control group is needed to test a more specific hypothesis. For example, in many hospital outbreaks, investigators use an initial study to narrow their focus. They then conduct a second study, with more closely matched controls, to identify a more specific exposure or vehicle. In a large community outbreak of botulism in Illinois, investigators used three sequential case-control studies to identify the vehicle. In the first study, investigators compared exposures of case-patients and controls from the general public to implicate a restaurant. In a second study they compared restaurant exposures of case-patients and healthy restaurant patrons to identify a specific menu item, a meat and cheese sandwich. In a third study, investigators used radio broadcast appeals to identify healthy restaurant patrons who had eaten the implicated sandwich. Compared to case-patients who had also eaten the sandwich, controls were more likely to have avoided the onions that came with the sandwich. Type A Clostridium botulinum was then identified from a pan of leftover sautéed onions used to make only that particular sandwich.(44)
Finally, recall that one reason to investigate outbreaks is research. An outbreak may provide an “experiment of nature” that would be unethical to set up deliberately but from which the scientific community can learn when it does happen to occur. For example, the outbreak of West Nile virus in Queens, New York, in 1999 was promptly investigated to determine the extent of the outbreak and risk factors for disease so appropriate control measures could be developed and implemented.(45) However, capitalizing on this unfortunate “experiment of nature,” investigators continued to follow the patients to determine the persistence of IgM and the prognosis of patients up to two years after infection.(46,47) Thus, the investigations resulted not only in the development of appropriate control and prevention strategies, but also in increased knowledge about a health problem not previously seen or studied in the Western hemisphere.
When an outbreak occurs, whether it is routine or unusual, consider what questions remain unanswered about that particular disease and what kind of study you might do in this setting to answer some of those questions. The circumstances may allow you to learn more about the disease, its modes of transmission, the characteristics of the agent, host factors, and the like.
Step 10: Compare and reconcile with laboratory and environmental studies
While epidemiology can implicate vehicles and guide appropriate public health action, laboratory evidence can confirm the findings. The laboratory was essential in both the outbreak of salmonellosis linked to marijuana and in the Legionellosis outbreak traced to the grocery store mist machine. You may recall that the investigation of pneumonia among attendees of an American Legion conference in Philadelphia in 1976 that gave Legionnaires’ disease its name was not considered complete until a new organism was isolated in the laboratory some six months later.(48)
Environmental studies are equally important in some settings. They are often helpful in explaining why an outbreak occurred. For example, in the investigation of the outbreak of E. coli O157:H7 among visitors to a county fair, the epidemiologists were able to identify one very strong risk factor — consumption of beverages with ice purchased from a vendor in zone 6. Environmental inspection of the fairgrounds identified lack of chlorination of the well supplying water to that zone. Furthermore, the well was found to be close to the manure pits and a septic tank for the worker’s dormitory. Flourescein dye poured into the bathroom of the dorm found its way into the well water, revealing cross-contamination. Finally, laboratorians were able to culture E. coli from the well, the supply line, and the tap at zone 6.(49) Thus the epidemiologic, environmental, and laboratory arms of the investigation complemented one another, and led to an inescapable conclusion that the well had been contaminated and was the source of the outbreak.
While you may not be an expert in these other areas, you can help. Use a camera to photograph working or environmental conditions. Coordinate with the laboratory, and bring back physical evidence to be analyzed.
Step 11: Implement control and prevention measures
In most outbreak investigations, the primary goal is control of the outbreak and prevention of additional cases. Indeed, although implementing control and prevention measures is listed as Step 11 in the conceptual sequence, in practice control and prevention activities should be implemented as early as possible. The health department’s first responsibility is to protect the public’s health, so if appropriate control measures are known and available, they should be initiated even before an epidemiologic investigation is launched. For example, a child with measles in a community with other susceptible children may prompt a vaccination campaign before an investigation of how that child became infected.
Confidentiality is an important issue in implementing control measures. Healthcare workers need to be aware of the confidentiality issues relevant to collection, management and sharing of data. For example, in the treatment of tuberculosis (TB), the relationship between the patient and the healthcare worker is extremely important because of the serious consequences of treatment failure. If patient information is disclosed to unauthorized persons without the patient’s permission, the patient may be stigmatized or experience rejection from family and friends, lose a job, or be evicted from housing. Moreover, the healthcare worker may lose the trust of the patient, which can affect adherence to TB treatment. Therefore, confidentiality — the responsibility to protect a patient’s private information — is critical in TB control and many other situations.(50)
In general, control measures are usually directed against one or more segments in the chain of transmission (agent, source, mode of transmission, portal of entry, or host) that are susceptible to intervention. For some diseases, the most appropriate intervention may be directed at controlling or eliminating the agent at its source. A patient with a communicable disease such as tuberculosis, whether symptomatic or asymptomatic, may be treated with antibiotics both to clear the infection and to reduce the risk of transmission to others. For an environmental toxin or infectious agent that resides in soil, the soil may be decontaminated or covered to prevent escape of the agent.
Some interventions are aimed at blocking the mode of transmission. Interruption of direct transmission may be accomplished by isolation of someone with infection, or counseling persons to avoid the specific type of contact associated with transmission. Similarly, to control an outbreak of influenza-like illness in a nursing home, affected residents could be cohorted, that is, put together in a separate area to prevent transmission to others. Vehicle borne transmission may be interrupted by elimination or decontamination of the vehicle. For example, contaminated foods should be discarded, and surgical equipment is routinely sterilized to prevent transmission. Efforts to prevent fecal-oral transmission often focus on rearranging the environment to reduce the risk of contamination in the future and on changing behaviors, such as promoting hand washing. For airborne diseases, strategies may be directed at modifying ventilation or air pressure, and filtering or treating the air. To interrupt vector borne transmission, measures may be directed toward controlling the vector population, such as spraying to reduce the mosquito population that may carry West Nile virus.
Some simple and effective strategies protect portals of entry. For example, bed nets are used to protect sleeping persons from being bitten by mosquitoes that may transmit malaria. A dentist’s mask and gloves are intended to protect the dentist from a patient’s blood, secretions, and droplets, as well to protect the patient from the dentist. Wearing of long pants and sleeves and use of insect repellent are recommended to reduce the risk of Lyme disease and West Nile virus infection.
Some interventions aim to increase a host’s defenses. Vaccinations promote development of specific antibodies that protect against infection. Similarly, prophylactic use of antimalarial drugs, recommended for visitors to malaria-endemic areas, does not prevent exposure through mosquito bites but does prevent infection from taking root.
Step 12: Initiate or maintain surveillance
Once control and prevention measures have been implemented, they must continue to be monitored. If surveillance has not been ongoing, now is the time to initiate active surveillance. If active surveillance was initiated as part of case finding efforts, it should be continued. The reasons for conducting active surveillance at this time are twofold. First, you must continue to monitor the situation and determine whether the prevention and control measures are working. Is the number of new cases slowing down or, better yet, stopping? Or are new cases continuing to occur? If so, where are the new cases? Are they occurring throughout the area, indicating that the interventions are generally ineffective, or are they occurring only in pockets, indicating that the interventions may be effective but that some areas were missed?
Second, you need to know whether the outbreak has spread outside its original area or the area where the interventions were targeted. If so, effective disease control and prevention measures must be implemented in these new areas.
Step 13: Communicate findings
As noted in Step 1, development of a communications plan and communicating with those who need to know during the investigation is critical. The final task is to summarize the investigation, its findings, and its outcome in a report, and to communicate this report in an effective manner. This communication usually takes two forms:
Textbox module not selected or not found.- An oral briefing for local authorities. If the field investigator is responsible for the epidemiology but not disease control, then the oral briefing should be attended by the local health authorities and persons responsible for implementing control and prevention measures. Often these persons are not epidemiologists, so findings must be presented in clear and convincing fashion with appropriate and justifiable recommendations for action. This presentation is an opportunity for the investigators to describe what they did, what they found, and what they think should be done about it. They should present their findings in a scientifically objective fashion, and they should be able to defend their conclusions and recommendations.
- A written report. Investigators should also prepare a written report that follows the usual scientific format of introduction, background, methods, results, discussion, and recommendations. By formally presenting recommendations, the report provides a blueprint for action. It also serves as a record of performance and a document for potential legal issues. It serves as a reference if the health department encounters a similar situation in the future. Finally, a report that finds its way into the public health literature serves the broader purpose of contributing to the knowledge base of epidemiology and public health.
In recent years, the public has become more aware of and interested in public health. In response, health departments have made great strides in attempting to keep the public informed. Many health departments strive to communicate directly with the public, usually through the media, both during an investigation and when the investigation is concluded.
References (This Section)
- Palmer SR. Epidemiology in search of infectious diseases: methods in outbreak investigation. J Epidemiol Comm Health 1989;43:311–4.
- Last JM. A dictionary of epidemiology, 4th ed. New York: Oxford U Press, 2001:129.
- PAHO. Case definitions: meningococcal disease and viral meningitis. Epidemiol Bull 2001;22(4):14–6.
- Centers for Disease Control and Prevention. Eosinophilia-myalgia syndrome — New Mexico. MMWR 1989;38:765–7.
- Centers for Disease Control and Prevention. Eosinophilia-myalgia syndrome and L-tryptophan-containing products — New Mexico, Minnesota, Oregon, and New York, 1989. MMWR 1989;38:785–8.
- Centers for Disease Control and Prevention. Public health dispatch: outbreak of listeriosis — northeastern United States, 2002. MMWR 2002;51:950–1.
- Jernigan DB, Raghunathan PL, Bell BP, Brechner R, Bresnitz EA, Butler JC, et al. Investigation of bioterrorism-related anthrax, United States, 2001: epidemiologic findings. Emerg Infect Dis 2002;8:1019–28.
- Heyman DL, ed. Control of communicable diseases manual, 18th ed. Washington, DC: American Public Health Association, 2004.
- Peterson LR, Marshall SL, Barton-Dickson C, Hajjeh RA, Lindsley MD, Warnock DW, et al. Coccidioidomycosis among workers at an archaeologic site, northeast Utah. Emerg Infect Dis 2004;10:637–42.
- Snow J. Snow on cholera. London: Humphrey Milford: Oxford U Press, 1936.
- Tan C. A preventable outbreak of pneumococcal pneumonia among unvaccinated nursing home residents — New Jersey, 2001. Presented at Northeast Regional Epidemic Intelligence Service Conference, March 14, 2002, New York City.
- Lukacs SL, Hsu V, Harper S, Handzel T, Hayslett J, Khabbaz R, et al. Anthrax outbreak averted: public health response to a contaminated envelope on Capital Hill–Washington, DC, 2001. Presented at 51st Annual Epidemic Intelligence Service Conference, April 22–26, 2004, Atlanta.
- Ramsey AH, Belongia EA, Gale CM, Davis JP. Outcomes of treated human granulocytic ehrlichiosis cases. Emerg Infect Dis 2002;8:383–401.
- Mahoney FJ, Hoge CW, Farley TA, Barbaree JM, Breiman RF, Benson RF, McFarland LM. Communitywide outbreak of Legionnaires’ disease associated with a grocery store mist machine. J Infect Dis 1992;165: 736–9.
- Torok TJ, Tauxe RV, Wise RP, Livengood JR, Sokolow R, Mauvais S, et al. A large community outbreak of salmonellosis caused by intentional contamination of restaurant salad bars. JAMA 1997;278:389–95.
- Hedberg CW, Fishbein DB, Janssen RS, Meyers B, McMillen JM, MacDonald KL, et al. An outbreak of thyrotoxicosis caused by the consumption of bovine thyroid gland in ground beef. N Engl J Med 1987;316:993–8.
- Jacobus CH, Holick MF, Shao Q, Chen TC, Holm IA, Kolodny JM, et al. Hypervitaminosis D associated with drinking milk. New Engl J Med 1992;326:1173–7.
- Blank S, Scanlon KS, Sinks TH, Lett S, Falk H. An outbreak of hypervitaminosis D associated with the overfortication of milk from a home-delivery dairy. Am J Public Health 1995;85:656–9.
- Jani AA, Barrett E, Murphy J, Norton D, Novak C, Painter J, Toney D. A steamship full of trouble: an outbreak of Salmonella Typhimurium DT 104 gastroenteritis at a holiday banquet — Virginia, 2003. Presented at the 53rd Annual Epidemic Intelligence Service Conference; 2004 Apr 19–23; Atlanta.
- Centers for Disease Control and Prevention. Outbreak of histoplasmosis among industrial plant workers — Nebraska, 2004. MMWR 2004;53:1020–2.
- Becker KM, Moe CL, Southwick KL, MacCormack JN. Transmission of Norwalk virus during a football game. N Engl J Med 2000;343;1223–7.
- Taylor DN, Wachsmuth IK, Shangkuan YH, Schmidt EV, Barrett TJ, Schrader JS, et al. Salmonellosis associated with marijuana: a multistate outbreak traced by plasmid fingerprinting. New Engl J Med 1982;306:1249–53.
- MacDonald KL, Spengler RF, Hatheway CL, Hargrett NT, Cohen ML. Type A botulism from sauteed onions. JAMA 1985;253:1275–8.
- Nash D, Mostashari F, Fine A, Miller J, O’Leary D, Murray K, et al. The outbreak of West Nile virus infection in the New York City area in 1999. N Engl J Med 2001;344:1807–14.
- Roehrig JT, Nash D, Maldin B, Labowitz A, Martin DA, Lanciotti RS, et al. Persistence of virus-reactive serum immunoglobulin M antibody in confirmed West Nile virus encephalitis cases. Emerg Infect Dis 2003;9:376–9.
- Klee AL, Maldin B, Edwin B, IPoshni I, Mostashari F, Fine A, et al. Long-term prognosis for clinical West Nile Virus infection. Emerg Infect Dis 2004;10:1405–11.
- Fraser DW, Tsai TF, Orenstein W, Parkin WE, Beecham HJ, Sharrar RG, et al. Legionnaires’ disease: description of an epidemic of pneumonia. N Engl J Med 1977;297:1189–97.
- Bopp DJ, Saunders BD, Waring AL, Waring AL, Ackelsberg J, Dumas N, et al. Detection, isolation, and molecular subtyping of Escherichia coli O157:H7 and Campylobacter jejuni associated with a large waterborne outbreak. J Clin Microbiol 2003;41:174–80.
- Division of Tuberculosis Elimination [Internet]. Atlanta: CDC; [updated 1999 Oct; cited 2006 Sep 19]. Self study modules on Tuberculosis, Module 7: Confidentiality in Tuberculosis Control: Background. Available from: https://www.cdc.gov/nchstp/tb/pubs/ssmodules/module7/ss7background.htm.
Textbox module not selected or not found.Textbox module not selected or not found.Textbox module not selected or not found.
