Age
‹View Table of Contents
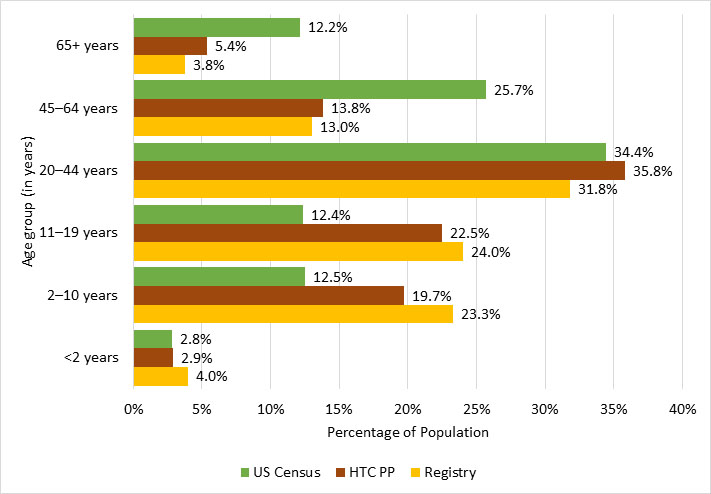
Overall, males with hemophilia in the Registry were slightly younger than those in the HTC PP. Compared to the 2014 U.S. male population,[1] participants in both the Registry and the HTC PP were much younger. Fifty–one percent and 45%, respectively, of the Registry and HTC PP participants with hemophilia were younger than 20 years of age, as compared to only 28% of the U.S. population in this age category. Seventeen percent and 19%, respectively, of Registry and HTC PP participants with hemophilia were 45 years of age or older, compared to 38% of the U.S. population in this age category (Figure 2).
Age Group and Hemophilia Type
Overall, male Registry participants with hemophilia A and hemophilia B were younger than their counterparts in the HTC PP.
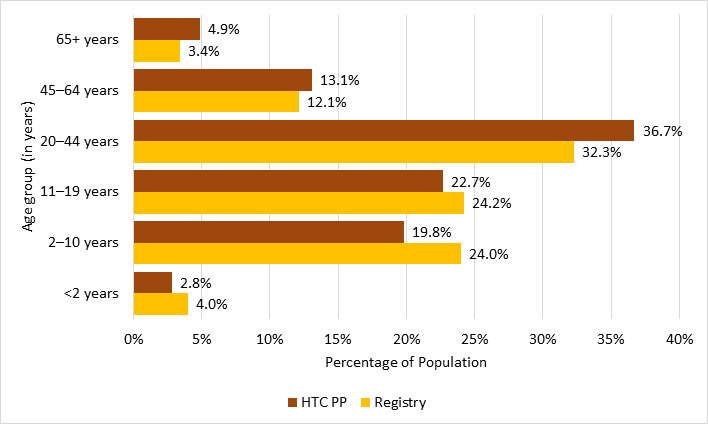
Fifty-two percent of male Registry participants with hemophilia A were 20 years of age or younger, compared with 45% in the HTC PP. Sixteen percent of Registry participants with hemophilia A were 45 years of age or older, compared to 18% of those in the HTC PP (Figure 3).
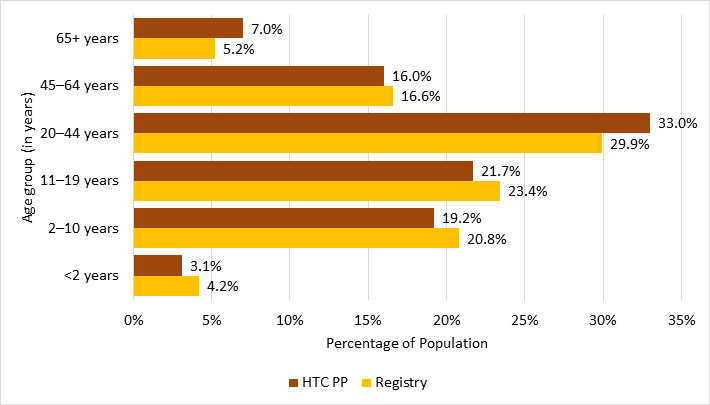
Forty-eight percent of the Registry participants with hemophilia B were 20 years of age or younger, compared with 44% of those in the HTC PP. Twenty-two percent of Registry participants with hemophilia B were 45 years of age or older, compared to 23% of those in the HTC PP (Figure 4).
Figure 2. Age comparison of male Registry participants, male HTC PP participants, and males in the U.S. Census (2014 estimates)

| Age | US Census | HTC PP | Registry | |||
|---|---|---|---|---|---|---|
| <2 years | 4,504,821 | 2.8% | 596 | 2.9% | 370 | 4.0% |
| 2–10 years | 19,850,424 | 12.5% | 4,067 | 19.7% | 2,138 | 23.3% |
| 11–19 years | 19,556,634 | 12.4% | 4,653 | 22.5% | 2,203 | 24.0% |
| 20–44 years | 54,485,511 | 34.4% | 7,413 | 35.8% | 2,919 | 31.8% |
| 45–64 years | 40,641,737 | 25.7% | 2,848 | 13.8% | 1,194 | 13.0% |
| 65+ years | 19,278,040 | 12.2% | 1,107 | 5.4% | 349 | 3.8% |
Figure 3. Age comparison of male Registry and HTC PP participants with hemophilia A

| Age | HTC PP | Registry | ||
|---|---|---|---|---|
| <2 years | 446 | 2.8% | 290 | 4.0% |
| 2–10 years | 3,134 | 19.8% | 1,744 | 24.0% |
| 11–19 years | 3,598 | 22.7% | 1,760 | 24.2% |
| 20–44 years | 5,809 | 36.7% | 2,352 | 32.3% |
| 45–64 years | 2,072 | 13.1% | 879 | 12.1% |
| 65+ years | 768 | 4.9% | 251 | 3.4% |
Figure 4. Age comparison of male Registry and HTC PP participants with hemophilia B

| Age | HTC PP | Registry | ||
|---|---|---|---|---|
| <2 years | 150 | 3.1% | 80 | 4.2% |
| 2–10 years | 933 | 19.2% | 394 | 20.8% |
| 11–19 years | 1,055 | 21.7% | 443 | 23.4% |
| 20–44 years | 1,604 | 33.0% | 567 | 29.9% |
| 45–64 years | 776 | 16.0% | 315 | 16.6% |
| 65+ years | 339 | 7.0% | 98 | 5.2% |
Severity by Age and Hemophilia Type
Among male participants with hemophilia A, most Registry participants, ages 0–44 years, were categorized as severe and the plurality of participants ages 45–64 years were categorized as severe (44%). However, among Registry participants ages 65 years and older, only 21% were categorized as severe; most (59%) were categorized as mild. Hemophilia A severity in the HTC PP showed a similar pattern by age as was seen in Registry participants (Table 2).
Among male participants with hemophilia B, a different pattern was seen. In the Registry, the majority of male babies and children younger than 2 years of age with hemophilia B were categorized as severe (53%), while in the total HTC PP, the proportion of severe hemophilia B for this age group was lower (36%). In the Registry, the proportion of hemophilia B categorized as severe was 44% among children 2–10 years of age, 38% among adolescents 11–19 years of age, and 43% among adults 20–44 years of age, while in the total HTC PP, the corresponding proportions of severe hemophilia B were lower. In both the Registry and the HTC PP, the proportion of hemophilia B categorized as severe was near 30% among participants between the ages of 45 to 64 and near 20% among participants 65 years of age and older (Table 3).
In both the Registry and the HTC PP, the proportion of hemophilia B categorized as moderate was much higher than the proportion of hemophilia A categorized as moderate in all age groups (Table 3 versus Table 2).
| Registry | HTC PP | |||||||||||
|---|---|---|---|---|---|---|---|---|---|---|---|---|
| Mild | Moderate | Severe | Mild | Moderate | Severe | |||||||
| n | % | n | % | n | % | n | % | n | % | n | % | |
| <2 years | 34 | 11.7% | 58 | 20.0% | 195 | 67.2% | 118 | 26.5% | 76 | 17.0% | 238 | 53.4% |
| 2–10 years | 355 | 20.4% | 298 | 17.1% | 1,082 | 62.0% | 856 | 27.3% | 586 | 18.7% | 1,660 | 53.0% |
| 11–19 years | 409 | 23.2% | 292 | 16.6% | 1,053 | 59.8% | 1,085 | 30.2% | 652 | 18.1% | 1,847 | 51.3% |
| 20–44 years | 421 | 17.9% | 383 | 16.3% | 1,532 | 65.1% | 1,373 | 23.6% | 1,029 | 17.7% | 3,359 | 57.8% |
| 45–64 years | 307 | 34.9% | 180 | 20.5% | 382 | 43.5% | 804 | 38.8% | 401 | 19.4% | 847 | 40.9% |
| 65+ years | 147 | 58.6% | 51 | 20.3% | 52 | 20.7% | 456 | 59.4% | 155 | 20.2% | 149 | 19.4% |
| Age total | 1,673 | 23.0% | 1,262 | 17.3% | 4,296 | 59.0% | 4,692 | 29.6% | 2,899 | 18.3% | 8,100 | 51.2% |
*45 patients in the Registry and 136 patients in HTC PP with unknown severity are not shown
| Registry | HTC PP | |||||||||||
|---|---|---|---|---|---|---|---|---|---|---|---|---|
| Mild | Moderate | Severe | Mild | Moderate | Severe | |||||||
| n | % | n | % | n | % | n | % | n | % | n | % | |
| <2 years | 8 | 10.00% | 28 | 35.00% | 42 | 52.50% | 42 | 28.00% | 48 | 32.00% | 54 | 36.00% |
| 2–10 years | 77 | 19.50% | 145 | 36.80% | 172 | 43.70% | 256 | 27.40% | 389 | 41.70% | 274 | 29.40% |
| 11–19 years | 102 | 23.00% | 174 | 39.30% | 167 | 37.70% | 299 | 28.30% | 466 | 44.20% | 285 | 27.00% |
| 20–44 years | 120 | 21.20% | 201 | 35.40% | 243 | 42.90% | 390 | 24.30% | 619 | 38.60% | 581 | 36.20% |
| 45–64 years | 88 | 27.90% | 125 | 39.70% | 97 | 30.80% | 238 | 30.70% | 319 | 41.10% | 212 | 27.30% |
| 65+ years | 38 | 38.80% | 39 | 39.80% | 20 | 20.40% | 140 | 41.30% | 145 | 42.80% | 53 | 15.60% |
| Age total | 433 | 22.80% | 712 | 37.50% | 741 | 39.10% | 1,365 | 28.10% | 1,986 | 40.90% | 1,459 | 30.00% |
*11 patients in the Registry and 47 patients in HTC PP with unknown severity are not shown
Pages in this Report
- Highlights & Acknowledgements
- Background
- Methods
- Geographic Distribution of Registry Participants
- Diagnosis & Severity
- Registry Characteristics
- ›Age
- Race/Ethnicity
- Education
- Weight Status
- Health Insurance Coverage
- Viral and Vaccination History
- Healthcare Utilization and Absenteeism
- Family History and Genetic Mutation
- Complications
- Treatment
- Procedures and Comorbid Conditions
- Technical Notes
- Participating HTCs