Complications
‹View Table of Contents
Detectable Inhibitor
Inhibitors are antibodies that complicate a bleeding disorder by preventing clotting factor concentrate treatment from working. The majority of male Registry participants had no history of detectable inhibitor titers. Participants with severe hemophilia A were much more likely (25%) to have a history of detectable inhibitors than participants with moderate (10%) or mild (4%) hemophilia A. Likewise, participants with severe hemophilia B were much more likely to have a history of detectable inhibitors (9%) than those with moderate or mild hemophilia B (both 1%).
Figure 23. History of detectable inhibitors among male Registry participants with hemophilia A
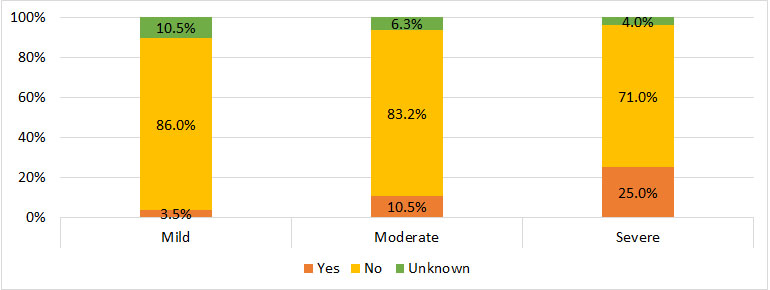
| Mild | Moderate | Severe | ||||
|---|---|---|---|---|---|---|
| Yes | 59 | 3.5% | 132 | 10.5% | 1072 | 25.0% |
| No | 1439 | 86.0% | 1050 | 83.2% | 3052 | 71.0% |
| Unknown | 175 | 10.5% | 80 | 6.3% | 172 | 4.0% |
Figure 24. History of detectable inhibitors among male Registry participants with hemophilia B
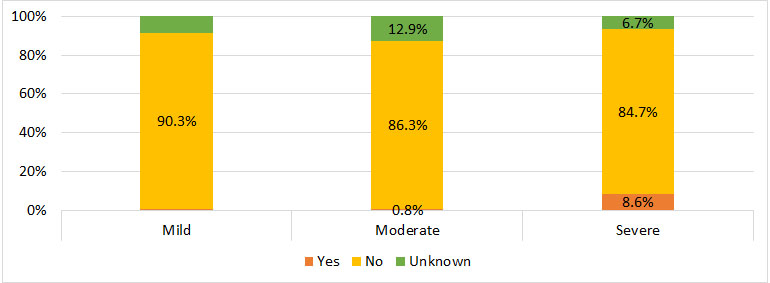
| Mild | Moderate | Severe | ||||
|---|---|---|---|---|---|---|
| Yes | * | * | 6 | 0.8% | 64 | 8.6% |
| No | 391 | 90.3% | 614 | 86.3% | 627 | 84.7% |
| Unknown | * | * | 92 | 12.9% | 50 | 6.7% |
* Counts less than six have been suppressed to protect patient confidentiality
Central Venous Access Device (CVAD)
Male Registry participants with hemophilia A were more likely to have had a CVAD placed than participants with hemophilia B (33% vs. 20%) (Table 16).
Table 16. CVAD placement among male Registry participants with hemophilia A or B
| Hemophilia A | Hemophilia B | ||||
|---|---|---|---|---|---|
| # | % | # | % | ||
| Yes | 2,430 | 33.40% | 369 | 19.50% | |
| No | 4,594 | 63.10% | 1,470 | 77.50% | |
| Unknown | 252 | 3.50% | 58 | 3.10% | |
Intracranial hemorrhage (ICH)
Approximately 8% of male participants with hemophilia experienced ICH prior to Registry enrollment; it was experienced most often among participants with severe hemophilia. Among male Registry participants with severe hemophilia A, 11% had a history of ICH, compared to 5% with moderate hemophilia and 4% with mild hemophilia. Among male Registry participants with severe hemophilia B, 12% had a history of ICH, compared to 6% with moderate hemophilia and 4% with mild hemophilia.
Figure 25. The proportion of male Registry participants with a history of ICH, by hemophilia type and severity
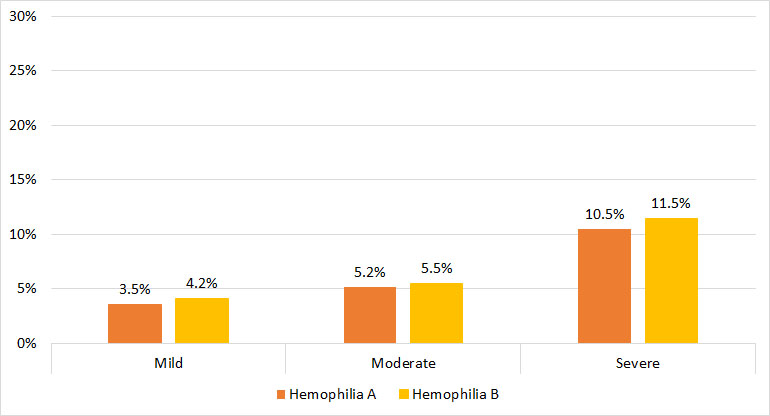
| Mild | Moderate | Severe | ||||
|---|---|---|---|---|---|---|
| Hemophilia A | 59 | 3.5% | 65 | 5.2% | 449 | 10.5% |
| Hemophilia B | 18 | 4.2% | 39 | 5.5% | 85 | 11.5% |
Joint Bleeds
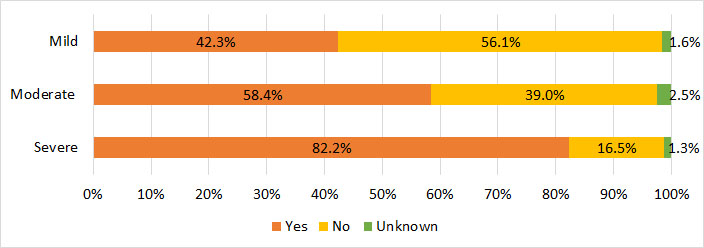
A history of having ever experienced a joint bleed was most common among male Registry participants with severe hemophilia, regardless of hemophilia type (Figures 26 and 27).
Figure 26. The proportion of male Registry participants with hemophilia A who previously experienced a joint bleed, by severity
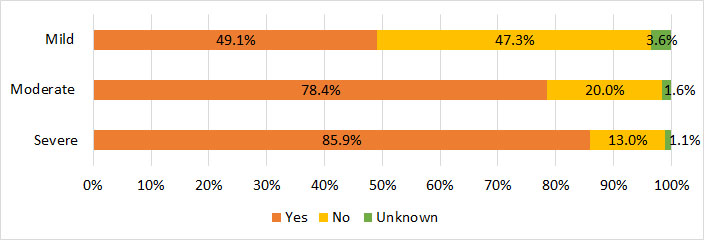
| Mild | Moderate | Severe | ||||
|---|---|---|---|---|---|---|
| Yes | 822 | 49.1% | 989 | 78.4% | 3,690 | 85.9% |
| No | 791 | 47.3% | 253 | 20.0% | 559 | 13.0% |
| Unknown | 60 | 3.6% | 20 | 1.6% | 47 | 1.1% |
Figure 27. The proportion of male Registry participants with hemophilia B who previously experienced a joint bleed, by severity
| Mild | Moderate | Severe | ||||
|---|---|---|---|---|---|---|
| Yes | 183 | 42.3% | 416 | 58.4% | 609 | 82.2% |
| No | 243 | 56.1% | 278 | 39.0% | 122 | 16.5% |
| Unknown | 7 | 1.6% | 18 | 2.5% | 10 | 1.3% |
Joint Procedures
Twenty percent of male Registry participants with hemophilia A reported having a joint procedure in the past, compared to 16% of male participants with hemophilia B. As participants aged, they were more likely to have experienced a joint procedure. Two percent of male participants with hemophilia A, ages 2–10 years, experienced a joint procedure, compared to 8% of participants ages 11–19 years, 32% of participants ages 20–44 years, 45% of participants ages 45–65 years, and 40% of participants ages 65 years and older. Among male hemophilia B participants, approximately 1% of those ages 2–10 years experienced a joint procedure compared to 5% were of participants ages 11–19 years, 22% of participants ages 20–44 years 37% of participants ages 45–64 years, and 36% of participants ages 65 years and older (Table 17).
Table 17. History of having undergone at least one joint procedure among male Registry participants, by age and hemophilia type
| <2 years | 2–10 years | 11–19 years | 20–44 years | 45–64 years | 65+ years | |||||||
|---|---|---|---|---|---|---|---|---|---|---|---|---|
| # | % | # | % | # | % | # | % | # | % | # | % | |
| Hemophilia A | ||||||||||||
| Yes | * | * | 33 | 1.9% | 145 | 8.2% | 760 | 32.3% | 397 | 45.2% | 100 | 39.8% |
| No | 290 | 100.0% | 1,702 | 97.6% | 1,601 | 91.0% | 1,531 | 65.1% | 454 | 51.6% | 144 | 57.4% |
| Unknown | * | * | 9 | 0.5% | 14 | 0.8% | 61 | 2.6% | 28 | 3.2% | 7 | 2.8% |
| Hemophilia B | ||||||||||||
| Yes | * | * | * | * | 24 | 5.4% | 123 | 21.7% | 116 | 36.8% | 35 | 35.7% |
| No | 80 | 100.0% | 387 | 98.2% | 414 | 93.5% | 432 | 76.2% | 187 | 59.4% | 61 | 62.2% |
| Unknown | * | * | * | * | * | * | 12 | 2.1% | 12 | 3.8% | * | * |
* Counts less than six have been suppressed to protect patient confidentiality
Pages in this Report
- Highlights & Acknowledgements
- Background
- Methods
- Geographic Distribution of Registry Participants
- Diagnosis & Severity
- Registry Characteristics
- Age
- Race/Ethnicity
- Education
- Weight Status
- Health Insurance Coverage
- Viral and Vaccination History
- Healthcare Utilization and Absenteeism
- Family History and Genetic Mutation
- ›Complications
- Treatment
- Procedures and Comorbid Conditions
- Technical Notes
- Participating HTCs