Race/Ethnicity
PAGE 8 of 19
‹View Table of Contents
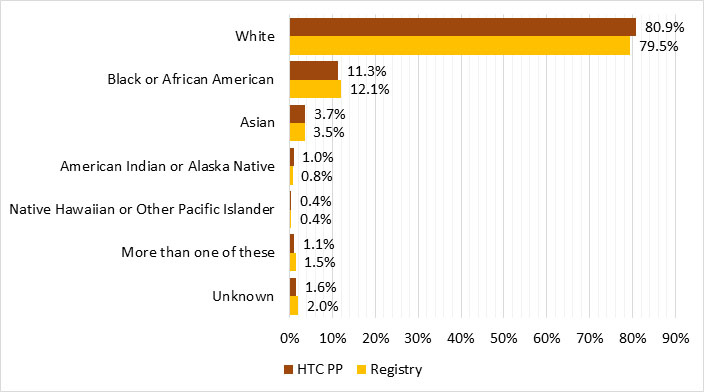
The racial distribution of Registry and HTC PP participants were similar (Figure 5). Overall, 80% of Registry participants were white (hemophilia A: 79%; hemophilia B: 83%), 12% were black or African-American (hemophilia A: 13%; hemophilia B: 10%), and 5% were Asian, American Indian/Alaska Native (AI/AN), or Native Hawaiian or other Pacific Islander (NH/PI) (hemophilia A: 5%; hemophilia B: 5%) (Figure 5).
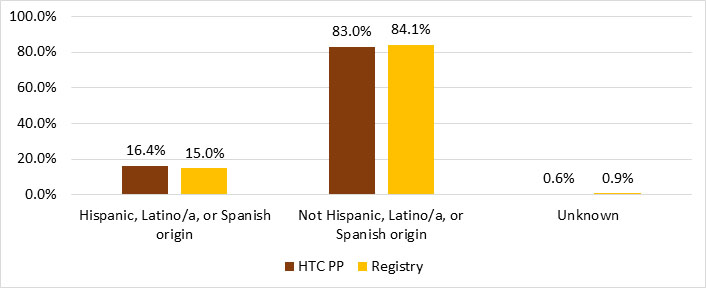
The majority of participants in the Registry (84%) and HTC PP (83%) were non-Hispanic compared to Hispanic (15% Registry; 16% HTC PP), with less than 1% of participants with unknown ethnicity for both Registry and HTC PP (Figure 6).
Figure 5. Racial distribution of male Registry and HTC PP participants

| HTC PP | Registry | |||
|---|---|---|---|---|
| Race | n | % | n | % |
| White | 16,734 | 80.9% | 7,292 | 79.5% |
| Black or African American | 2,345 | 11.3% | 1,112 | 12.1% |
| Asian | 756 | 3.7% | 325 | 3.5% |
| American Indian/Alaska Native | 206 | 1.0% | 74 | 0.8% |
| Native Hawaiian or Other Pacific Islander | 90 | 0.4% | 40 | 0.4% |
| More than one of these | 231 | 1.1% | 142 | 1.5% |
| Unknown | 322 | 1.6% | 188 | 2.0% |
Figure 6. Ethnic distribution of male Registry and HTC PP participants with hemophilia

| HTC PP | Registry | |||
|---|---|---|---|---|
| Ethnicity | n | % | n | % |
| Hispanic, Latino/a, or Spanish origin | 3,392 | 16.4% | 1,375 | 15.0% |
| Not Hispanic, Latino/a, or Spanish origin | 17,160 | 83.0% | 7,717 | 84.1% |
| Unknown | 132 | 0.6% | 81 | 0.9% |
Pages in this Report
- Highlights & Acknowledgements
- Background
- Methods
- Geographic Distribution of Registry Participants
- Diagnosis & Severity
- Registry Characteristics
- Age
- ›Race/Ethnicity
- Education
- Weight Status
- Health Insurance Coverage
- Viral and Vaccination History
- Healthcare Utilization and Absenteeism
- Family History and Genetic Mutation
- Complications
- Treatment
- Procedures and Comorbid Conditions
- Technical Notes
- Participating HTCs