Education
PAGE 10 of 18
‹View Table of Contents
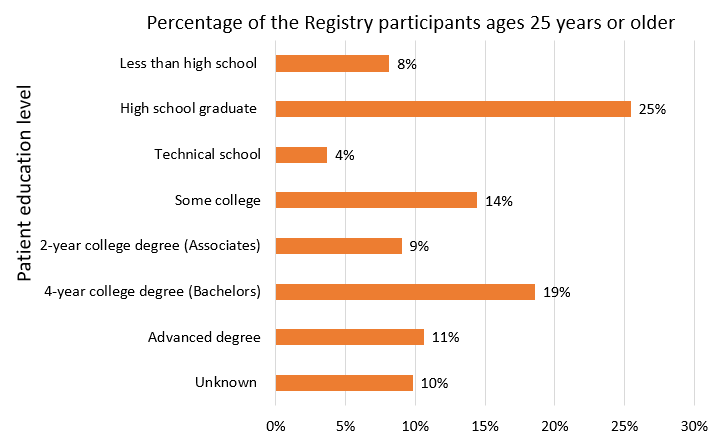
Among the Registry participants who were 25 years of age or older (n = 1,255, 39.7%), 8% had less than a high school degree and 25% were a high school graduate or had passed their General Educational Development (GED) exam. Fifty-seven percent had an education greater than a high school degree. Ten percent of these participants had unknown or other types of education. (Figure 5).
Figure 5: Highest education level attained by the Registry participants 25 years of age and older, 2014

| Education Level | N | % |
|---|---|---|
| Less than high school | 102 | 8% |
| High School Graduate | 319 | 25% |
| Technical School | 46 | 4% |
| Some College | 181 | 14% |
| 2-year college degree (Associates) | 113 | 9% |
| 4-year college degree (Bachelors) | 233 | 19% |
| Advanced Degree | 133 | 11% |
| Other | 5 | 0% |
| Unknown | 123 | 10% |
Pages in this Report
- Highlights & Acknowledgements
- Background
- Methods
- Geographic Distribution of Registry Participants
- Registry Characteristics 2014
- Diagnosis
- Sex
- Age
- Race/Ethnicity
- ›Education
- Weight Status
- Health Insurance Coverage
- Health Insurance Coverage by Age
- Viral and Vaccination Status
- Use of Healthcare Services and Absenteeism
- Chronic Diseases, Conditions, or Surgical Procedures
- Technical Notes
- Participating HTCs