Race/Ethnicity
PAGE 9 of 18
‹View Table of Contents
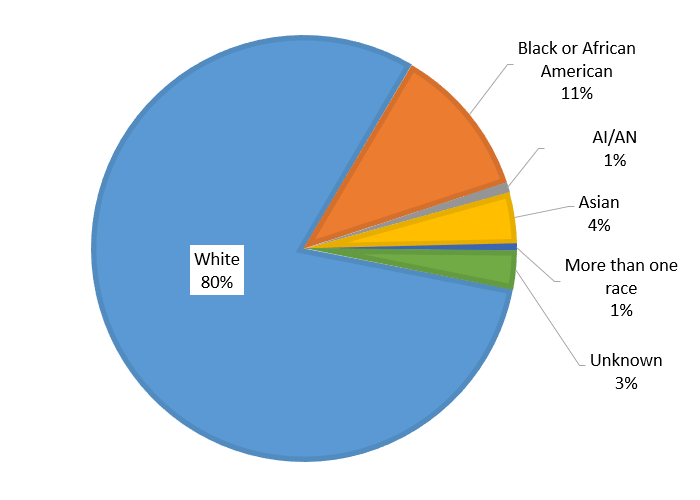
The majority of the Registry participants were non-Hispanic (n = 2,750, 87%) compared to Hispanic (n=358, 11%), with 2% unknown. Eighty percent were White, 11% were Black or African-American, and 5% were Asian, American Indian/Alaska Native, or Native Hawaiian or other Pacific Islander (Figure 4).
Figure 4: Racial distribution of the Registry participants, 2014

| Race | N | % |
|---|---|---|
| American Indian/Alaska Native | 26 | 1% |
| Asian | 109 | 3% |
| Black or African American | 363 | 11% |
| Native Hawaiian or Other Pacific Islander | 15 | 0% |
| White | 2541 | 80% |
| More than one of these | 15 | 0% |
| Unknown | 92 | 3% |
Pages in this Report
- Highlights & Acknowledgements
- Background
- Methods
- Geographic Distribution of Registry Participants
- Registry Characteristics 2014
- Diagnosis
- Sex
- Age
- ›Race/Ethnicity
- Education
- Weight Status
- Health Insurance Coverage
- Health Insurance Coverage by Age
- Viral and Vaccination Status
- Use of Healthcare Services and Absenteeism
- Chronic Diseases, Conditions, or Surgical Procedures
- Technical Notes
- Participating HTCs