National Enteric Disease Surveillance: Shiga toxin-producing E. coli (STEC) Annual Report, 2017
Read an overview of surveillance methods and systems for STEC infections [PDF – 4 pages].
The Laboratory-based Enteric Disease Surveillance (LEDS) system contributes to the understanding of human Shiga toxin-producing Escherichia coli (STEC) in the United States by collecting reports submitted by state and regional public health laboratories. Reporting to LEDS is voluntary; the number of laboratories submitting reports varies somewhat from year to year, although almost all public health laboratories report every year. This report includes only the first isolate of a given STEC serogroup per person within a 30-day period if more than one was reported. Data on whether the illness was clinically compatible with STEC infection are not provided with these laboratory reports; we call the reports STEC infections because we assume that specimens were obtained because of illness.
Data in this report are current as of April 6, 2020.
Summary
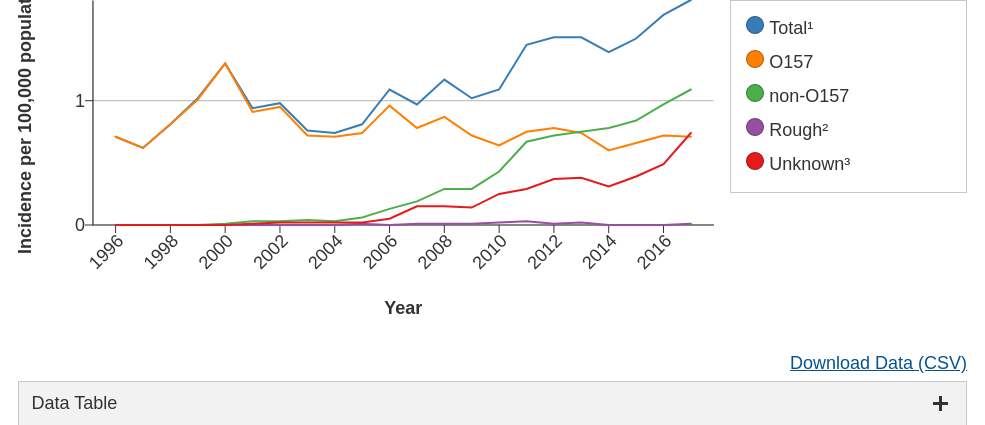
- In 2017, 52 state and regional public health laboratories reported 6,034 Shiga toxin-producing Escherichia coli (STEC) infections, including 2,363 O157, 3,646 non-O157, and 25 with serogroup categorized as ‘Rough.’
- An additional 2,460 STEC reports were submitted with unknown serogroup, representing a 55% increase from 2016, likely due to disruptions in the reporting of data due to implementation of whole genome sequencing methods.[1]
- Compared with 2016, the incidence of STEC O157 infections decreased slightly (↓1%) while non-O157 infections increased (↑7%).
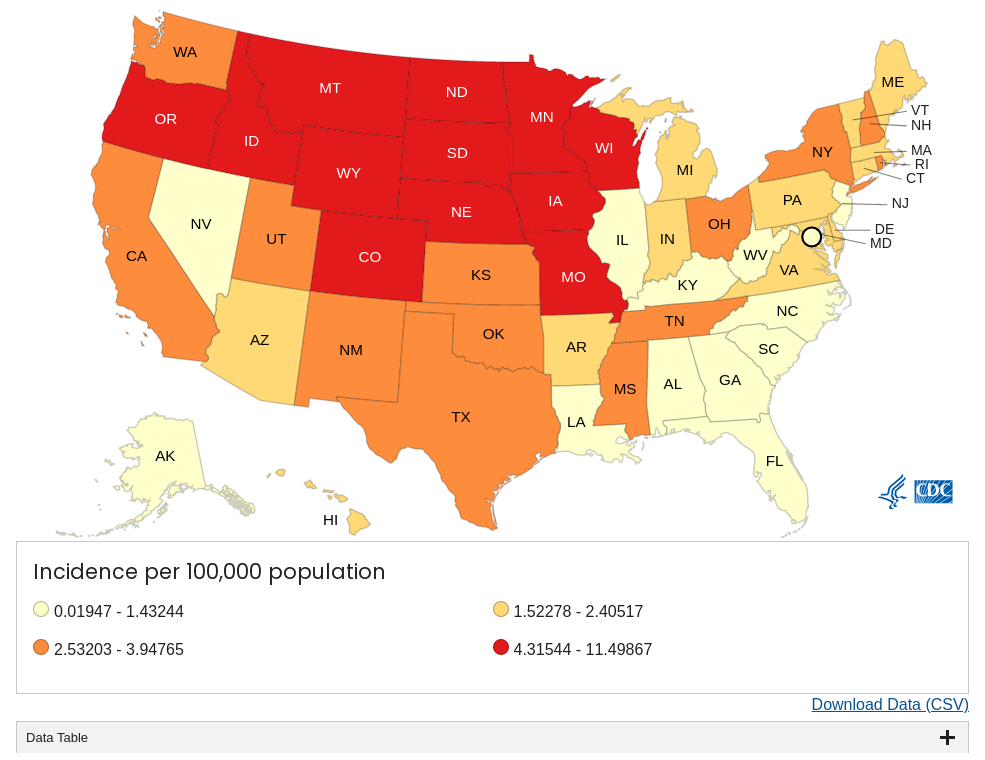
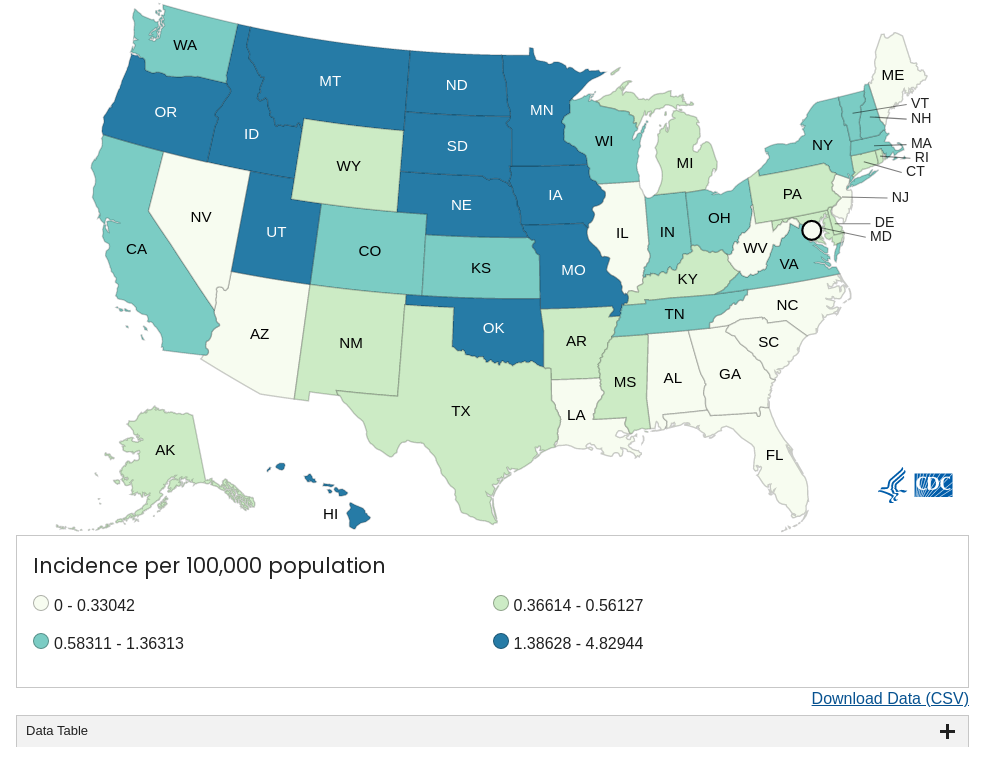
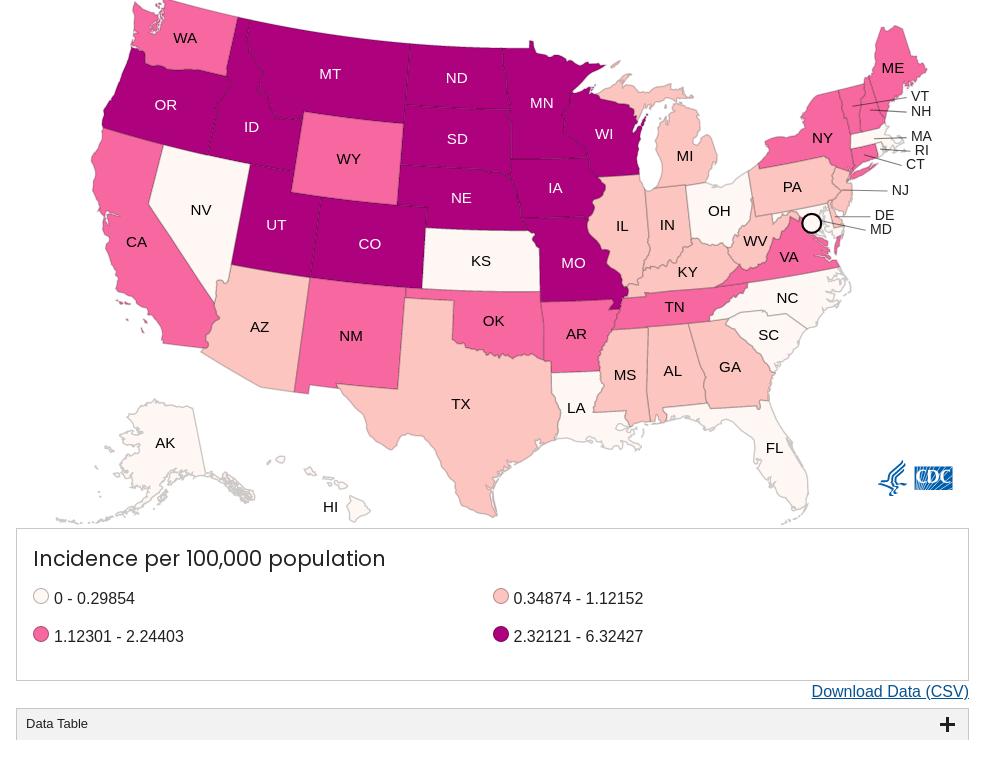
- Most states with higher incidence compared with national average were in the West and Midwest regions.[2]
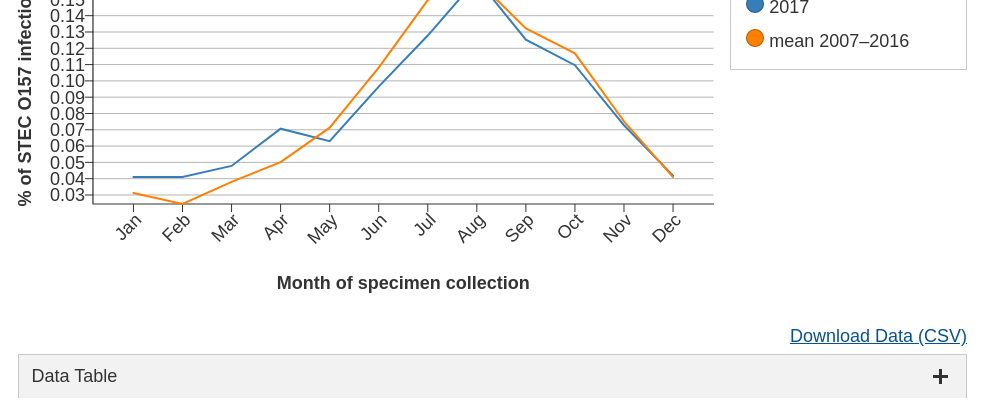
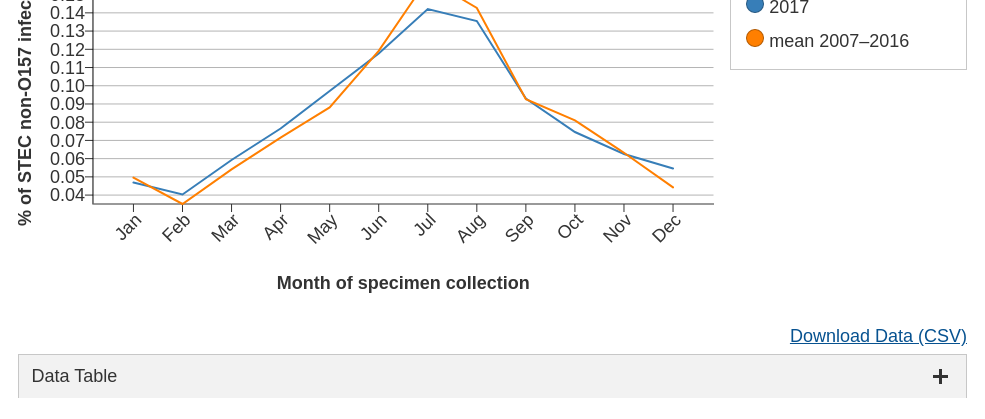
- The largest percentages of O157 and non-O157 infections were reported in the summer months.
[1] The practice of testing stool for Shiga toxin by culture-independent diagnostic tests (CIDTs) without concomitant bacterial culture and serotyping has increased in recent years (2) (3). LEDS does not collect information on test type and so cannot differentiate between reports of CIDTs positive for Shiga toxin without isolation of E. coli and reports in which E. coli was isolated and not serogrouped or the serogroup was not reported.
[2] Geographic regions in this report are those defined by the United States Census Bureau [PDF – 2 pages]
Figure 1. Incidence of STEC infections reported to LEDS, by serogroup and year, United States, 1996–2017
1 The Total category includes infections of serogroup O157, non-O157 serogroups, and Rough isolates.
2 The Rough category includes isolates for which an O antigen could not be determined because the strain autoagglutinated (agglutinated in all antisera and diluent). Strains behaving in this manner are often blocked in one or more steps of O antigen synthesis and typically appear flat with irregular edges when grown on solid media. These isolates could be O157 or non-O157 STEC.
3 The Unknown category includes reports of CIDTs positive for Shiga toxin without isolation of E. coli and reports in which E. coli was isolated and the serogroup was not determined or not reported. LEDS does not currently collect information on test type and cannot differentiate between these two types of reports. Many clinical laboratories report detection of Shiga toxin by CIDT as “STEC” without isolating E. coli and determining that the isolated organism can produce Shiga toxin; reports in the Unknown category would meet CSTE criteria for a probable case of STEC if the person had clinically compatible illness.
Table 1a. STEC infections reported to LEDS, with the 10 most frequently reported serogroups listed individually, United States, 2017
| Rank | Serogroup | Number reported | Percent | Incidence per 100,000 |
|---|---|---|---|---|
| 1 | O157 | 2,363 | 39.2 | 0.71 |
| 2 | O26 | 986 | 16.3 | 0.3 |
| 3 | O103 | 962 | 15.9 | 0.29 |
| 4 | O111 | 741 | 12.3 | 0.23 |
| 5 | O121 | 229 | 3.8 | 0.07 |
| 6 | O145 | 200 | 3.3 | 0.06 |
| 7 | O45 | 80 | 1.3 | <0.01 |
| 8 | O118 | 55 | 0.9 | <0.01 |
| 9 | O186 | 36 | 0.6 | <0.01 |
| 9 | O71 | 36 | 0.6 | <0.01 |
| Non-ranked | Non-O157, other serogroups | 206 | 3.4 | 0.06 |
| Non-ranked | Non-O157, undetermined serogroup* | 115 | 1.9 | 0.03 |
| Subtotal, all non-O157 | 3,646 | 60.4 | 1.09 | |
| Rough** | 25 | 0.4 | <0.01 | |
| All serogroups | 6,034 | 100 | 1.81 |
* The “Non-O157, undetermined serogroup” category includes isolates with an O antigen that could not be determined because the strain failed to agglutinate or agglutinated non-definitively in antisera against the currently recognized E. coli O antigens. We were unable to determine if this was due to inadequate expression of a known O antigen or expression of a new O antigen.
** The “Rough” category includes isolates with an O antigen that could not be determined because the strain autoagglutinated (agglutinated in all antisera and diluent). Strains behaving in this manner are often blocked in one or more steps of O antigen synthesis and typically appear flat with irregular edges when grown on solid media. These isolates could be O157 or non-O157 STEC.
Table 1b. Incidence per 100,000 of STEC O157 and non-O157 infections reported to LEDS, by age group and sex, United States, 2017
| Age group, years | O157 (n = 2,185) | Non-O157 (n = 3,360) | |||
|---|---|---|---|---|---|
| Female | Male | Female | Male | ||
| <1 | 1.14 | 0.89 | 4.11 | 4.32 | |
| 1–4 | 3.07 | 3.43 | 4.66 | 5.23 | |
| 5–9 | 1.3 | 1.51 | 1.1 | 1.56 | |
| 10–19 | 0.86 | 1.23 | 1.43 | 1.5 | |
| 20–29 | 0.73 | 0.5 | 1.64 | 0.89 | |
| 30–39 | 0.34 | 0.29 | 0.85 | 0.39 | |
| 40–49 | 0.31 | 0.17 | 0.6 | 0.27 | |
| 50–59 | 0.33 | 0.15 | 0.41 | 0.27 | |
| 60–69 | 0.42 | 0.23 | 0.55 | 0.29 | |
| 70–79 | 0.41 | 0.55 | 0.55 | 0.55 | |
| ≥80 | 0.41 | 0.48 | 0.68 | 0.46 | |
| Overall | 0.67 | 0.68 | 1.11 | 0.95 | |
Figure 2a. Incidence of STEC infections reported to LEDS, by reporting jurisdiction, United States, 2017 (n = 8,494) *,**
*Includes infections of rough, unknown, and undetermined serogroups.
**The incidence cut points in the legend are computed sample quantiles
Figure 2b. Incidence of human STEC O157 infections reported to LEDS, by reporting jurisdiction, United States, 2017 (n = 2,363)*
* The incidence cut points in the legend are computed sample quantiles
Figure 2c. Incidence of human STEC non-O157 infections reported to LEDS, by reporting jurisdiction, United States, 2017 (n = 3,646) *,**
* Non-O157 category Includes isolates with undetermined serogroup.
** The incidence cut points in the legend are computed sample quantiles
Figure 2d. Incidence of the five most common serogroups of non-O157 STEC infections reported to LEDS, by reporting jurisdiction, United States, 2017*
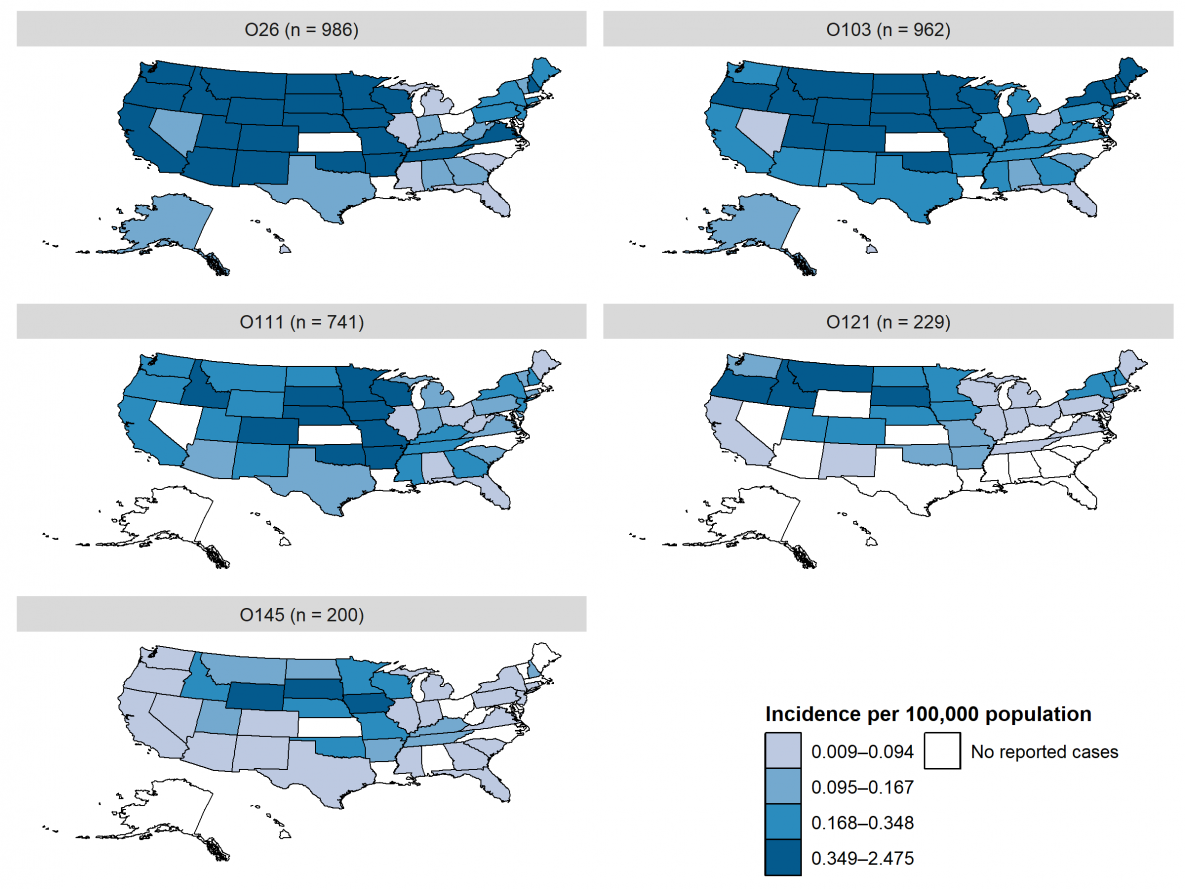
The incidence of STEC O26 infections was highest in western and midwestern states, similar to STEC O157. The incidence of STEC O103 infections was also relatively high in western and midwestern states, and it was the predominant non-O157 STEC serogroup in northeastern states. The incidence of O111 and O145 STEC infections was highest in midwestern states. The incidence of O121 STEC infections was highest in northwestern states.
*The incidence cut points in the legend are computed sample quantiles
Figure 3. Percentage of STEC O157 infections reported to LEDS, by month of specimen collection, United States, 2017, and mean annual percentage during 2007–2016
Figure 4. Percentage of non-O157 STEC infections reported to LEDS, by month of specimen collection, United States, 2017, and mean annual percentage during 2007–2016
** Non-O157 category Includes isolates with undetermined serogroup
Report Appendices
Access the data file for the report appendices, listed below [XLS – 49 KB].
Appendix 1. Culture-confirmed STEC infections reported to LEDS by serogroup, age group, and sex, 2017
Appendix 2a. Culture-confirmed STEC infections reported to LEDS by serogroup and reporting jurisdiction, 2017 (Alaska to Kansas)
Appendix 2b. Culture-confirmed STEC infections reported to LEDS by serogroup and reporting jurisdiction, 2017 (Kentucky to Nevada)
Appendix 2c. Culture-confirmed STEC infections reported to LEDS by serogroup and reporting jurisdiction, 2017 (New York to Wyoming)
Appendix 3. STEC infections reported to LEDS by serogroup and year, 2007–2017
- Centers for Disease Control and Prevention (CDC). National STEC Surveillance Overview. Atlanta, Georgia: US Department of Health and Human Services, CDC, 2012.
- Iwamoto, Martha, et al. Bacterial enteric infections detected by culture-independent diagnostic tests—FoodNet, United States, 2012–2014. MMWR Morb Mortal Wkly Rep. 2015 Mar 13;64(9):252–7. PubMed
- Marder EP, Cieslak PR, Cronquist AB, et al. Incidence and trends of infections with pathogens transmitted commonly through food and the effect of increasing use of culture-independent diagnostic tests on surveillance — Foodborne Diseases Active Surveillance Network, 10 U.S. Sites, 2013–2016. MMWR Morb Mortal Wkly Rep. 2017 Apr 21;66(15):397-403. DOI PubMed
Recommended Citation:
Centers for Disease Control and Prevention (CDC). National Shiga toxin-producing Escherichia coli (STEC) Surveillance Annual Report, 2017. Atlanta, Georgia: US Department of Health and Human Services, CDC, 2021.
